yyu624
A-Share Limit-Up Ladder Review
Enter a trading date or limit-up data/screenshot to automatically organize an A-share limit-up ladder, with a four-part analysis covering sector tiers, market sentiment, key stock commentary, and next-day watchlist ideas. Generate a polished, shareable review poster. Supports two styles: dark tech (default) and minimalist off-white.

CCTV News Stock Radar
Analyze each day’s News Broadcast to identify policy and industry signals worth noting for A-share investors. Assess the potential impact on the broader market, map affected sectors, and analyze positive and negative implications for specific stocks. The result is a polished, poster-style visual web report (not investment advice).

Finance Short Video Kit
Turn a finance news story into a complete set of ready-to-shoot short-video assets: a 60- or 90-second voiceover script, a shot-by-shot storyboard, visual-generation prompts for each shot, image-to-video camera-motion prompts, and a data provenance card. Take the package straight into 即梦, 可灵, or Midjourney to create visuals—no need to break down the script yourself. The biggest difference from other short-video asset tools is the data layer. In finance content, getting even one number wrong can cause serious problems once the video is published. This Skill verifies key figures for each assignment online, records the source and date for each one, and provides a separate provenance card showing which shot contains each figure, what it measures, and where it came from. If a figure cannot be verified, it is removed rather than filled in from the model’s memory. The voiceover script follows the actual rhythm of short-form video: the first three seconds deliver a hook, not a greeting or setup; the middle section presents one point at a time, with sentences kept short enough to speak smoothly; and the ending leaves an observation to verify rather than forcing a conclusion. Visual prompts consistently use a vertical format, the same style keywords, and a no text parameter, so a dozen shots look like one cohesive video instead of a collection of unrelated images. Choose from three visual styles: Data Studio (deep blue and gold, charts, and floating numbers), Urban Financial Documentary (the realistic look of office buildings and trading floors), and Minimalist Bold Type (solid-color backgrounds with oversized text that stands out in an information feed). The default output is a text-only asset kit for faster delivery. When you need to review the visuals, you can generate a single keyframe preview separately. Suitable for finance creators, brokerage and fund social media teams, business analysis accounts, and any team that needs to quickly turn financial events into video content. This Skill does not recommend stocks or provide buy-and-sell advice.

A-Share Market Thermometer
One command after the close delivers **a web page that does the calculation itself**: within 1–2 seconds of opening, it concurrently pulls 80 daily K-line data points in your own browser, scores the 6 major A-share indices plus 74 industries and themes on a 0–100 temperature scale, and renders the results as a two-page, 1080px-wide dashboard long image—ready to screenshot for Xiaohongshu or WeChat Official Account. Data goes through no intermediary and doesn't rely on an author-provided data source—your browser connects directly to the market data interface. So every time you open it, you get the latest live market data, not a static image that expires the next day. The temperature isn't “AI intuition”—it's a formula hard-coded in the page source. For the three factors—price deviation from MA60, 20-day returns, and 5-day returns—each one takes its own historical percentile over the past 250 trading days, and then RSI14 weighting is added. It uses percentiles rather than absolute gains/losses because banks may move 20% a year while theme sectors move 200%; only by converting to each one's historical position can they be compared on the same scale. Real example: on the same day, the finance & real estate and green power sectors had nearly identical 5-day and 20-day gains and sat right next to each other in the gain rankings. But their temperatures were 87 (high heat) and 50 (neutral)—because the former had risen above MA60 and hit its hottest level in a year, while the latter was just a small rebound after a deep drop. Seven qualitative levels: Ice Point / Low Temperature / Slightly Cool / Neutral / Warming / High Heat / Boiling Point. Automatic signals: temperature ≤20 and a rise of ≥5 degrees in the past 3 days = rebound watch; temperature ≥80 and a drop of ≥5 degrees in the past 3 days = pullback watch. Thresholds are hard-coded; if none are hit, it reports zero—it doesn't force a match. All 80 are publicly released CSI/CNI standard indices, with the code list hard-coded in the page. The algorithm is in the source code—you can inspect and reproduce it yourself. The same closing data always produces the same number no matter who runs it. It only measures temperature for indices and sectors, not individual stocks. It only presents hot/cold distributions and pattern signals; it does not recommend stocks, predict price movements, or constitute investment advice. Trigger words: market temperature / A-share thermometer / sector temperature / sector heat / market sentiment / sentiment indicator / is the market cold today / freezing point / boiling point / market overview / sector rotation / post-close review / temperature dashboard / market thermometer

US Stock Radar|Indices,Sectors
Ask 'How are US stocks today?' and get the three major indices, leading sectors (gainers and losers), key stocks, and 3 major events in 60 seconds. Expand to see all 11 sectors and a full 7-day panel when needed. Automatically detects pre-market, intraday, after-hours, and market close. Key percentage changes are recalculated, and important quotes are cross-verified where possible. Facts, inferences, and unknowns are labeled separately, with Eastern Time/Beijing Time and direct sources provided. Suitable for daily market checks, pre-market risk scans, post-market reviews, and individual stock anomaly verification. This skill is for public information research assistance only and does not constitute investment advice.

Stock Research Bundle
Six stock research skills packaged into a single pipeline, with one entry point that routes automatically. ① Market Snapshot: Current price, valuation, 52-week range, data accurate to the minute. ② Earnings Anomalies: Doesn't restate the report, only highlights what has actually changed. ③ Hot Topic Analysis: Event transmission chain and evidence from both bullish and bearish sides. ④ Industry Chain View: Upstream/midstream/downstream mapping, competitor threat grading, and SWOT evidence chain. ⑤ Deep Research Engine: A seven-dimensional framework to thoroughly analyze a company's business. ⑥ Master Checklist: Side-by-side comparison from the perspectives of Buffett, Munger, Peter Lynch, Fisher, and Graham. How to use: Just drop a stock name for Panorama mode (snapshot + positioning + three major findings + drill-down suggestions). If you have a specific request, go directly to the corresponding step (e.g., 'Moutai, show earnings' or 'Zhongci Electronics, show industry chain'). You can continuously drill down on the same stock without interruption. Three iron rules: Numbers are traceable; if not found, mark as 'Temporarily Unavailable' and never fabricate. No stock recommendations, no target prices, no price predictions. Facts, calculations, and inferences are labeled separately. Running through these six steps individually is far more valuable than the bundle price. All outputs include data cutoff dates and source lists. This does not constitute any investment advice.

Stock Industry Chain & SWOT
Gives you a stock's position in the industry chain, not a conclusion. This skill performs 10+ online searches and outputs a five-layer industry chain analysis report: one-sentence positioning (which link it occupies and why), upstream/midstream/downstream chain breakdown (each link with specific company names), competitive positioning (who might change the landscape), SWOT evidence chain (each item backed by data, no empty claims), and 3 verifiable tracking signals. Suitable for those who want to understand a company's 'real business model and whether its moat still holds'. All key figures are sourced; if not found, honestly marked as 'temporarily unavailable'. Full text does not constitute investment advice.

MarketSnap
There are many skills for checking market data, but only this one gives you a quote card that you can directly share. Enter a stock name, code, or "market", and it will: ① Fetch data from real-time quote APIs (not guessing prices from AI memory), with minute-accurate timestamps ② Provide a complete text overview: current price, change, turnover, turnover rate, PE/PB, market cap, 52-week position ③ Each time, give an extra institutional-style quote card (1080x1350 portrait) — large number price change visuals, indicator grid, valuation bar, 52-week range locator, deep blue gold color scheme, ready to share in group chats, Moments, or Xiaohongshu Four modes auto-detected: · Individual stock overview (default) · Multi-stock comparison (2-6 stocks, automatically highlights the best and worst performers) · Market overview (three major indices + turnover + number of advancing/declining stocks) · Detailed mode (adds recent 5-day trend + latest news) Attention to detail: · A-share/HK stocks: red for up, green for down; US stocks: green for up, red for down — automatically switches by market · Data API triple fallback chain; if all fail, it will honestly inform you, never fabricates data · Only presents data, no stock recommendations or predictions; every card includes a disclaimer Suitable for investors who check the market daily, finance group admins, and content creators who need market visuals.

Finance Hotspot Long-Image
Quickly transform complex financial hot topics into professional, intuitive long-image explainers and social media copy. Simply provide a financial event or news link, and this skill instantly generates a set of visual content containing key data, impact analysis, and unique insights, along with ready-to-publish Xiaohongshu copy. This skill excels at in-depth fact-checking and data tracing for financial events, ensuring all information is sourced and dated, making your content authoritative and trustworthy. It automatically maps out the event's background, compares key figures, and identifies potential knock-on effects, presenting them in polished card sets or long-image formats, with a color scheme and up/down indicators that follow professional market conventions. Whether you're analyzing Federal Reserve policy, interpreting company earnings, or tracking market movements, you'll get a visually professional, content-rigorous explanation. The final deliverables include a set of high-definition images (supports a single long image or a combination of multiple cards) and a post copy tailored to the platform, helping you stay on top of financial trends and produce quality content efficiently.

Deep Stock Research Engine
Not a news summary, but an individual stock research report with a methodological framework. Enter a company (A-share/H-share/US stock name or code), and it will perform 10-15 bilingual web searches to produce a report based on a seven-dimension framework: ① Business Model – where money comes from and goes, with a "translated into plain language" version ② Revenue Structure – breakdown by business, growth engines and drags ③ Moat – mandatory answer on widening or narrowing, using market share, gross margin, and pricing power ④ Financial Quality – cash flow vs profit alignment, changes in receivables, inventory, and goodwill ⑤ Competitive Landscape – competitor comparison table and concentration direction ⑥ Valuation Framework – only data and calculation framework, no judgment of over/undervaluation ⑦ Risk List – sorted by impact, each with verifiable trigger signals Each report includes: a one-page bull/bear summary (with substantial evidence on both sides), a next-quarter tracking list, and data sources for each point. Three iron rules: · Each key number is traceable to official filings or authoritative media; if not found, labeled 'insufficient information', never fabricated · Facts, calculations, and inferences are labeled separately · No stock price predictions, no target prices, no buy/sell advice – even for 'should I buy', only bull/bear evidence is given Supports three perspectives: Understand the Business (default), Financial Checkup, and Company Comparison. Suitable for investment researchers, financial content creators, and serious investors who want to systematically understand a company.

Guru Checklist: Buffett's View
Buffett's shareholder letters, Poor Charlie's Almanack, The Intelligent Investor—the standards of investment masters are public, but no one has ever helped you check them item by item. Enter a company (A-share/H-share/US stock), select a master's perspective: Buffett (default), Munger, Peter Lynch, Fisher, Graham. It will check online for public evidence corresponding to each standard, giving item-by-item judgments: ✅ Meets / ⚠️ Partially meets / ❌ Does not meet / ❓ Insufficient information, and generate a shareable scorecard long image (3:5 vertical, suitable for Xiaohongshu/WeChat Moments). Each delivery: ① Detailed check text: each standard with judgment, evidence, source and timestamp, plus "translation into plain English"—what this standard is really asking ② Scorecard summary (N/8 items met) + three most noteworthy points ③ A scorecard long image in classic value investing colors, ready to post Three golden rules: · Judgment must be backed by evidence; mark ❓ if not found, never fabricate data · Checklist items are faithful to the masters' published works, no fabricated "master standards" · Only present comparison results, do not represent the master's views, and do not constitute investment advice Repeat play: For the same company, check with all five masters, five perspectives cross-validate each other. Suitable for value investing learners, financial content creators, and ordinary investors who want to systematically understand a company.

Report Anomaly Graphic
Not a financial report rehash, but identifying where things really changed. Enter the name, ticker, report link, or PDF of an A-share, Hong Kong, or US-listed company. The tool automatically cross-checks official filings, compares key metrics on a like-for-like basis, and identifies growth accelerations or decelerations, margin shifts, cash flow anomalies, one-time items, and changes in management guidance. Each delivery includes: ① Source cards and key metrics table ② The most important report anomalies ③ Supporting evidence and risk checklist ④ Tracking indicators for the next quarter ⑤ A 3:5 or 9:16 investor long graphic ⑥ A ready-to-post short summary You can use it to: • Analyze Tencent's latest report, focusing on gaming, advertising, and capital expenditure • Compare NVIDIA's last two quarters to find accelerating or decelerating metrics • Check Kweichow Moutai's cash flow, contract liabilities, and channel inventory • Verify numbers and conclusions in a stock analysis article, then compile into a graphic All numbers must be traceable to original sources: company announcements, exchange filings, SEC, or company IR. Facts, calculations, and inferences are labelled separately. No fabricated missing data. No buy or sell recommendations. Ideal for investors, financial content creators, researchers, and corporate content teams.

EvidenceGraph | Research Graph
The more materials you have, the real difficulty is not summarization but seeing the relationships between concepts, people, events, and evidence. EvidenceGraph reads papers, PDFs, articles, meeting minutes, or multiple links, automatically extracts entities and relationships, merges duplicate concepts, flags conflicting information, and generates an interactive research graph that can be dragged, zoomed, searched, and filtered. Unlike ordinary mind maps, each key node and relationship retains source numbers, evidence descriptions, and confidence levels. Click a node to see why it appears in the graph, avoiding a web of relationships that is beautiful but unverifiable. One run delivers: - Interactive single-file HTML - High-resolution PNG / SVG static images - Editable Mermaid code - Structured JSON data - Source and conflict list Ideal for researchers, students, teachers, product managers, consultants, investment research, and knowledge workers who handle large volumes of material.

One Content, Five Platforms
You worked hard on a piece of content, and after posting it on one platform, you're done? Then you're wasting at least 80% of your traffic. But simply copy-pasting to other platforms is even worse—Xiaohongshu users think you're too formal, Zhihu users find you shallow, and Douyin viewers scroll away in 3 seconds. **Distribution is not copying; it's translation**: the same idea becomes five completely different species across five platforms. This skill is a multi-platform distribution expert who has worked with MCN agencies. One run gives you: 🔴 **Xiaohongshu version**: first-person experience post, 2-line hook + bulleted tips + interactive ending, with 2 title options and tiered tags 🟢 **WeChat Official Account version**: 1200-2000 word in-depth article, suspense intro + sectioned subheadings, with 3 title options (numbered, counter-intuitive, empathy) ⚫ **Douyin voiceover version**: 45-60 second word-for-word script, golden 3-second hook + shot cues, with scene transitions marked 🟠 **Weibo version**: 140-character sharp commentary, keeping only the most shareable point 🔵 **Zhihu version**: first constructs the most suitable question to answer, then outputs a "state the conclusion first" rational long answer ⭐ Three unique details: 1. Before rewriting, it outputs a "content asset inventory" (core ideas, golden quotes, emotional value). If ideas are too scattered, it helps you focus—not forced writing. 2. Each platform has an independent tone rule table—the Douyin version removes all written connectors, and the Zhihu version actively removes marketing language. 3. Before delivery, it performs consistency checks to ensure the five versions have completely consistent ideas and data, so they don't drift apart. 📌 Suitable for: all content creators—bloggers, self-media, brand account operators, knowledge payment hosts. As long as your content deserves to be seen by more people, this skill can save you 2 hours of rewriting time every day. ⚠️ Only serves original content distribution, not rewriting others' articles.

AI Opportunity Radar (Ongoing)
Every day, dig out product opportunities from AI hotspots that can actually make money. There's a lot of AI news, but few opportunities that can turn into real products. This Skill helps you filter out the noise and turn 'new models, new tools, new open-source projects, user complaints, competitor changes' into a startup radar: - What's the most worth-watching opportunity today? - Which users are really willing to pay? - Which direction can deliver an MVP in 1-2 weeks? - Where to find the first batch of customers? - How to decide whether to continue or give up within 7 days? Suitable for: - Indie developers wanting to build micro-SaaS - Entrepreneurs looking for AI startup directions - AI self-media/knowledge bloggers needing continuous topics - Product managers doing product strategy, competitive research, market insights - Investors/researchers wanting to turn industry data into actionable plans

Xiaohongshu Book Rec Video Gen
This is a fully automated Xiaohongshu book recommendation video generation tool based on the Volcengine Seedance 2.0 API. From book selection to publishing, it's done with one command. **Key Highlights**: - **Native Audio & Subtitles** - Seedance 2.0 directly generates voiceover and synchronized subtitles, eliminating post-production editing. - **Smart Book Selection** - Automatically captures low-follower viral books on Xiaohongshu, precisely targeting traffic drivers. - **Professional Storyboarding** - 6-7 meticulously designed scenes: opening suspense + core insights + emotional resonance. - **Chain Generation** - Each video starts with the last frame of the previous segment for smooth, natural transitions. - **One-Click Publishing** - Automatically generates titles, tags, and topics for direct posting to Xiaohongshu. **Use Cases**: - Daily video updates for book bloggers - Knowledge monetization content production

DataCanvas
Data speaks for itself; it just needs a stage. DataCanvas automatically transforms your CSV/Excel/JSON data into professional-grade visual analysis reports. Inspired by the anti-AI aesthetic philosophy of the 11k-star project huashu-design (banning purple gradients, emoji decorations, and bento grids), all charts are hand-coded in pure SVG without relying on any external JS libraries. It includes 6 report templates (Daily/Weekly Operations, Competitor Comparison, User Profiles, Investment Analysis, Free Report) x 5 design styles (Information Architecture, Oriental Minimalism, Swiss Grid, Dark Data, Business Classic), supporting over 20 chart types. From data upload to polished report, everything is automated: data cleaning, statistical analysis, trend insights, chart generation — all in one go.

SKILLS Refinement Workshop
Seven processes, one closed loop. SkillForge Refinement Workshop transforms the gstack engineering sprint methodology open-sourced by YC leader Garry Tan into a full lifecycle management system for Claude Code Skills. From six soul-searching questions to verify demand authenticity, to architecture planning, SKILL.md forging, quality review, eval testing, release packaging, and finally review and iteration—each stage has dedicated AI roles, with confidence scores and anti-spam mechanisms. It also includes two additional processes: emergency diagnosis and security audit. No 'good ideas,' only evidence-based judgments. Every skill is tempered through seven processes.
Personal Positioning Studio
Want to start creating content but don't know where to begin? The Personal Positioning Studio uses a 10-question diagnostic questionnaire, Golden Triangle analysis, and real-time market validation to help you find the best intersection of 'skill × passion × market demand'. It delivers a complete personal brand positioning report: one-sentence positioning, differentiation strategy, persona design, content pillars, monetization path, and a 30-day cold-start plan. Covers all platforms—Xiaohongshu, Douyin, WeChat Official Accounts, Bilibili, and WeChat Channels—taking you from confusion to clarity in one session.

SEO + GEO Visibility Engine
Rather than assigning a mysterious “GEO score,” this Skill determines whether a page can be crawled, retrieved, cited, and ultimately drive visits. This Skill audits content across two outcome tracks built on a shared foundation: traditional SEO focuses on crawlability, indexing, intent satisfaction, and click readiness; AI search focuses on retrieval eligibility, evidence quality, entity consistency, and citation readiness. It checks crawlers, robots, WAF/CDN, and observable metrics separately for Google AI Overviews / AI Mode, Bing / Copilot, ChatGPT Search, Perplexity, and Claude—so training crawlers aren’t confused with search crawlers. You’ll receive P0/P1/P2 priority lists, a claim-level evidence ledger, intent and query fan-out maps, entity conflicts, content information gain, applicable structured data recommendations, and a 30/60/90-day validation plan. Every recommendation is labeled with its evidence status, affected engine, specific change, effort, owner, and validation metric. Suitable for diagnosing, briefing, rewriting, and rechecking results for articles, product pages, landing pages, local pages, and content clusters. It won’t promise rankings, indexing, or AI citations; when data is insufficient, it will clearly state “unknown” and explain how to verify it.

Book of Answers
Life is full of choices. What to eat for lunch, whether to change jobs, whether to confess, whether to buy a plane ticket – big and small, there are always moments of hesitation. The Book of Answers, an ancient and simple ritual: close your eyes, silently recite your question, open the pages, and fate will give you an answer. It's not fortune-telling, not divination, but a conversation with your intuition. When you see that answer – whether it brings a knowing smile or makes you think – you already have the answer in your heart. This little tool contains over 120 oracles, covering nine categories including affirmation, negation, philosophy, humor, action, and warning. Bilingual in Chinese and English, switchable with one click. Exquisite starry card design, immersive page-turning ritual. After asking one question, you can switch and ask another. It won't make decisions for you, but it might gently nudge you when you're struggling. Sincerity works. Open your Book of Answers.

Multi-Source English Assistant
Multi-Source English Learning Assistant -- Automatically breaks down real English content from The Economist, BBC, China Daily, NPR, and more into systematic learning packs. Covers all levels from A1 to C2, automatically adapting to 6 key skills: vocabulary, grammar, listening, speaking, writing, and reading. Supports URL auto-capture, exam-oriented modes (IELTS, TOEFL, CET-4/6, Postgraduate Entrance), three difficulty levels for example sentences, Anki card export, and a 7-day review plan. Outputs beautifully formatted HTML learning materials.
OPC Solo Startup Accelerator
From a vague idea to a complete, executable startup plan for a one-person company. AI-driven market research, competitive analysis, and business modeling automatically generate a professional-grade HTML business plan including a business canvas, competitive matrix, tiered pricing, MVP plan, and 90-day roadmap. All market data is obtained through real-time search—no fabrication. A built-in 5-dimensional feasibility score helps you rationally decide if the direction is worth pursuing. Suitable for: people who want to start a one-person company, side hustle, or freelance but don't know where to start.
GitHub Trend Hunter
Enter keywords to automatically search for the most relevant open-source projects on GitHub. It quantitatively evaluates projects across six dimensions: popularity, activity, community health, code quality, documentation completeness, and growth momentum, and generates a visual HTML analysis report. Supports two modes: in-depth theme analysis (top N project ranking + comparison matrix + scenario recommendation) and daily trend digest (today's highlights + hot ranking + rising stars). Built-in GitHub API data collection scripts automatically retrieve core metrics such as Stars, Forks, Commits, and Contributors.
AI Autonomous Research Engine
AI Autonomous Deep Research Engine, inspired by Karpathy's AutoResearch project. It employs a multi-round autonomous iterative research loop: gather information, analyze and verify, self-assess on five dimensions, identify blind spots, and target improvements, iterating until the report meets standards. Supports scenarios such as market research, competitive analysis, technology selection, industry reports, and academic reviews, automatically adapting to 3-8 rounds of research depth. Outputs a visual HTML report with cited sources, including core findings, comparison matrix, scoring radar chart, and actionable recommendations. Each round outputs a progress summary, making the research process transparent. Suitable for creators, entrepreneurs, and researchers who need in-depth understanding of a domain and data-driven decision-making.

Xiaohongshu Cover Generator
A cover creation tool for Xiaohongshu bloggers! It includes 6 trending cover templates — Dry Goods List, Tutorial Steps, Breakdown Analysis, Comparison Review, Data Card, and Quote Highlights, paired with 5 carefully designed visual styles (Creamy, Dopamine, Magazine, Minimalist, Dark Cool), covering all scenarios from beauty and lifestyle to tech reviews. Simply describe your note content and instantly generate a beautiful 1080x1440 standard-sized cover image, saying goodbye to cover anxiety and giving every note a professional visual presentation. Supporting tools: Not sure what to post? Use the 'Xiaohongshu Low-Fan Popular Note Video Breakdown Report' to find reproducible topics; Get a check-up before posting with the 'Xiaohongshu Account Diagnosis and Note Review'.
Weibo Hot Topic Copy Generator
Weibo Hot Topic Copy Generator - Real-time capture of Weibo hot search trends, one-click generation of high-conversion Weibo copy. Supports 4 styles: marketing seeding, news information, entertainment interaction, and opinion commentary. Automatically recommends the best style based on topic classification. Built-in trending keyword filtering and category screening, paired with a practical copywriting guide and high-conversion hook formula, so every Weibo post can accurately ride trends, grab attention, and drive interaction.
ImageInfographic Maker
Easily turn any article, table, link, or casual note into a professional infographic, making your data and insights stand out. Whether it's a single poster or a multi-page carousel, this tool intelligently identifies content structure and automatically extracts key information—no manual formatting required. Choose from six chart types: timeline, flowchart, ranking, proportion, comparison, or funnel, and pair them with visual styles like Business Blue, Creative Color, Dark Tech, Elegant Warm, Minimalist Black & White, or Xiaohongshu-exclusive styles. We specially support Chinese content and brand colors to ensure visuals are both professional and aligned with your brand identity. Whether for annual reports, social media (e.g., Xiaohongshu, Instagram, X), or study notes, this tool generates high-resolution PNG images in multiple sizes, helping your information spread in the most appealing way. Say goodbye to tedious design work—create stunning infographics with one click, letting data speak and stories come alive. Companion tools: For final drafts to be published on WeChat Official Accounts, look for '公众号排版器'; for data tables needing publication-grade formatting, look for 'TableCraft'; for quote card sets, look for '知识卡片生成工坊'.
ResearchKnowledge Card Generator
Turn your articles, notes, quotes, or any inspiration into beautiful knowledge cards to easily share your insights. Whether it's reading notes, course highlights, or daily thoughts, this tool intelligently identifies core content, automatically selects the most suitable card type, and presents it in a professional and visually appealing style. You can choose to generate a single eye-catching knowledge card or create multiple linked "card sets" with one click, perfect for publishable swipeable carousel content on social platforms like Xiaohongshu and Instagram. It automatically designs a cover for you, extracts key points for each page, and attaches the source, ensuring your sharing is both deep and shareable. We offer six card types: quotes, key points, comparisons, steps, data, and concepts, paired with five curated visual styles: academic blue, warm literature, dark tech, magazine red, and minimalist black and white, with full support for Chinese content. You can also customize your brand primary color and account signature, giving each card a personal touch, ensuring knowledge output is as high-quality as input. For companion use: For long-text infographics, check out 'Infographic Maker'; for finished drafts to publish on WeChat Official Account, check out '公众号排版器'.

WeChat Post Formatter
Upload Markdown, plain text, or dictated drafts, and automatically deliver 3 ready-to-use outputs: ① HTML pasteable into WeChat Official Account, ② mobile long-image preview, ③ pre-publish check report. It doesn't just apply templates—it first restructures the reading hierarchy: separate subheadings, break long paragraphs, extract key quote cards, control bold density, then match a style from 6 professional bases. On first use, you can create a "Brand Style Profile" that records the Official Account name, primary and secondary colors, heading and quote styles, byline, and footer. Subsequent articles automatically reuse this to maintain visual consistency across the account. Before publishing, two rounds of checks are performed: first, check heading hierarchy, paragraphs, and content fidelity; second, check WeChat compatibility, including inline CSS, narrow screen overflow, garbled text, tables, images, and dangerous tags. Issues are fixed before delivery to reduce style loss and rework after pasting. Suitable for knowledge accounts, personal IP, industry analysis, reading notes, and branded content teams. Companion tools: For infographics in text, use "Infographic Maker"; to publish one article across multiple platforms, use "一鱼多吃 五平台分发器".
SlidesTableCraft
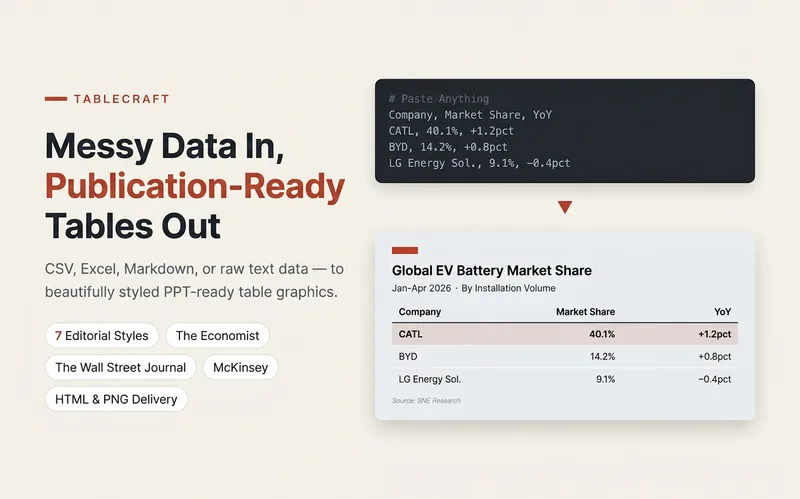
Transforms raw table data into professional, beautiful publication-grade charts, eliminating the hassle of manual formatting. Whether your data is in CSV, JSON, Markdown tables, directly pasted spreadsheet cells, or any other tabulable text, this tool intelligently parses and identifies header and numeric columns to ensure accurate data presentation. You can choose from seven carefully designed styles, including The Economist, The Wall Street Journal, Financial Times, McKinsey, Instagram social style, minimalist modern, and high-end dark. Each style has its own unique character and is suitable for different scenarios. Whether for financial reports, market analysis, corporate presentations, or social media posts, you will find the most fitting visual presentation. Just provide the data, and the tool automatically generates high-quality HTML files and PPT-ready PNG images, making your tables stand out in presentations, reports, or social posts. For complex situations like wide tables, long text, or mixed number formats, it also provides smart suggestions to ensure a flawless final result. Complementary tools: For infographics beyond tables, find "Infographic Maker"; for turning key points into card sets, find "Knowledge Card Generator Workshop".
Resume Master (Bilingual)
A one-stop high-end workplace document generator covering resumes, cover letters, business plans, weekly/monthly reports, LinkedIn profiles, and more, supporting both Chinese and English. Resume generation offers 3 beautiful design styles (Premium dual-column, Minimalist single-column, Creative layout), outputs A4-sized HTML pages that can be printed as PDF. Built-in JD smart matching engine: paste a job description to automatically analyze keywords and job essence, tailoring one resume per position. Supports uploading existing resumes for 6-dimension diagnostic optimization, intelligently rewrites weak expressions, adds quantitative data. Supports uploading photos to generate professional resumes with real headshots. Built-in STAR method, ATS optimization rules, 200+ strong verbs in Chinese and English, industry-specific templates, and error self-check checklist ensure every document meets professional standards. Suitable for job hunting, career changes, campus recruitment, autumn recruitment, fundraising pitches, daily reports, and all workplace document scenarios.
Ebbinghaus Memory Assistant
Make knowledge truly stick in your mind Based on the scientific principle of the forgetting curve, automatically schedule 8 rounds of spaced review (same day, 1 day, 2 days, 4 days, 7 days, 15 days, 30 days, 60 days) to convert short-term memory into long-term memory. Supports inputting any content: foreign language words, exam focus points, reading notes, professional concepts, work knowledge, unlimited types, freely categorizable. Three review methods: dialogue Q&A, email reminders, visual calendar. Data is persistently saved, so learned content is never lost. Just tell it what you want to remember, and let the system handle the rest.

Xiaohongshu Acct & Note Review
**Function 1: Account Diagnosis** - Provide any Xiaohongshu profile URL, automatically scrape data via browser - Score from 7 dimensions: bio & profile, cover design, title & copy, content diversity, engagement data, posting frequency, follower growth efficiency - Generate a visual HTML report with an optimization roadmap **Function 2: Pre-Publish Note Review** - Score upcoming notes (title/cover/body/tags) item by item (out of 100) - 4-level assessment: Ready to Publish / Minor Changes Needed / Requires Modification / Recommended Rework - If the user has had an account diagnosis, automatically cross-reference the diagnosis suggestions (e.g., check if the title still uses the homogenized sentence structure previously pointed out) - Directly provide optimized versions for items that don't meet standards

Xiaohongshu Viral Post Review
This Skill automates the entire process — from data scraping, follower count completion, like-follower ratio calculation, viral content selection, to content breakdown and report generation — all with one instruction.