
US Stock Radar|Indices,Sectors
3 indices, 11 sectors, stocks & events in 60s
Description
Ask 'How are US stocks today?' and get the three major indices, leading sectors (gainers and losers), key stocks, and 3 major events in 60 seconds. Expand to see all 11 sectors and a full 7-day panel when needed. Automatically detects pre-market, intraday, after-hours, and market close. Key percentage changes are recalculated, and important quotes are cross-verified where possible. Facts, inferences, and unknowns are labeled separately, with Eastern Time/Beijing Time and direct sources provided. Suitable for daily market checks, pre-market risk scans, post-market reviews, and individual stock anomaly verification. This skill is for public information research assistance only and does not constitute investment advice.
Related Skills
View all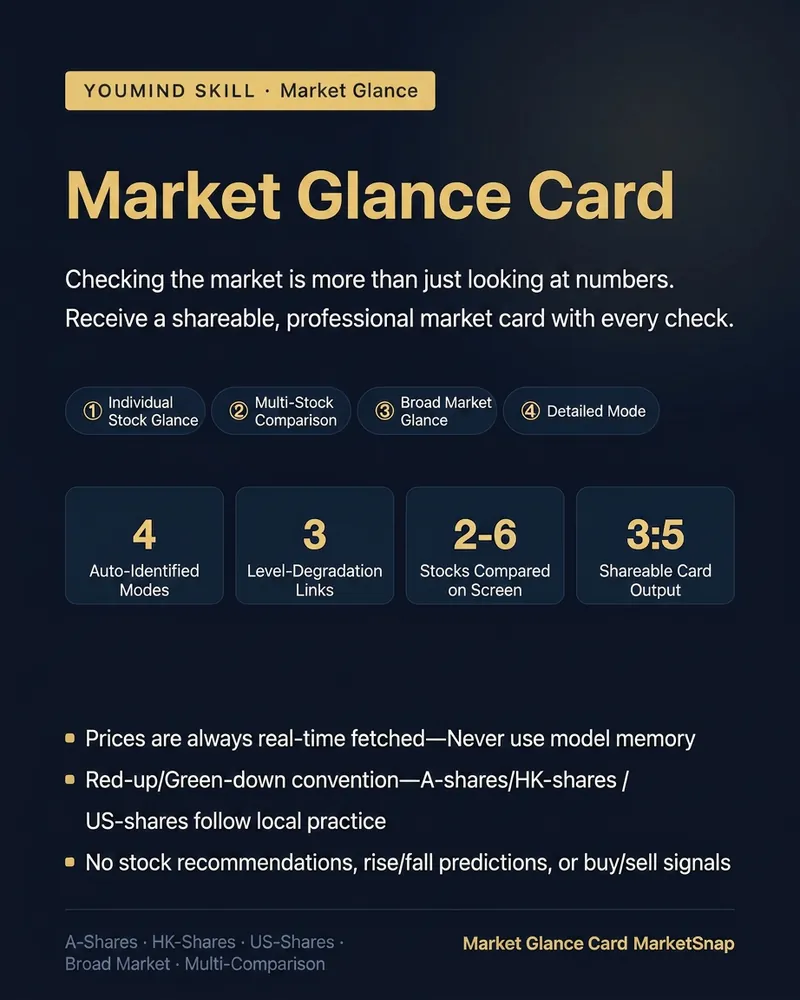
MarketSnap
There are many skills for checking market data, but only this one gives you a quote card that you can directly share. Enter a stock name, code, or "market", and it will: ① Fetch data from real-time quote APIs (not guessing prices from AI memory), with minute-accurate timestamps ② Provide a complete text overview: current price, change, turnover, turnover rate, PE/PB, market cap, 52-week position ③ Each time, give an extra institutional-style quote card (1080x1350 portrait) — large number price change visuals, indicator grid, valuation bar, 52-week range locator, deep blue gold color scheme, ready to share in group chats, Moments, or Xiaohongshu Four modes auto-detected: · Individual stock overview (default) · Multi-stock comparison (2-6 stocks, automatically highlights the best and worst performers) · Market overview (three major indices + turnover + number of advancing/declining stocks) · Detailed mode (adds recent 5-day trend + latest news) Attention to detail: · A-share/HK stocks: red for up, green for down; US stocks: green for up, red for down — automatically switches by market · Data API triple fallback chain; if all fail, it will honestly inform you, never fabricates data · Only presents data, no stock recommendations or predictions; every card includes a disclaimer Suitable for investors who check the market daily, finance group admins, and content creators who need market visuals.
 Research
A-share, HK & US Stock Quotes
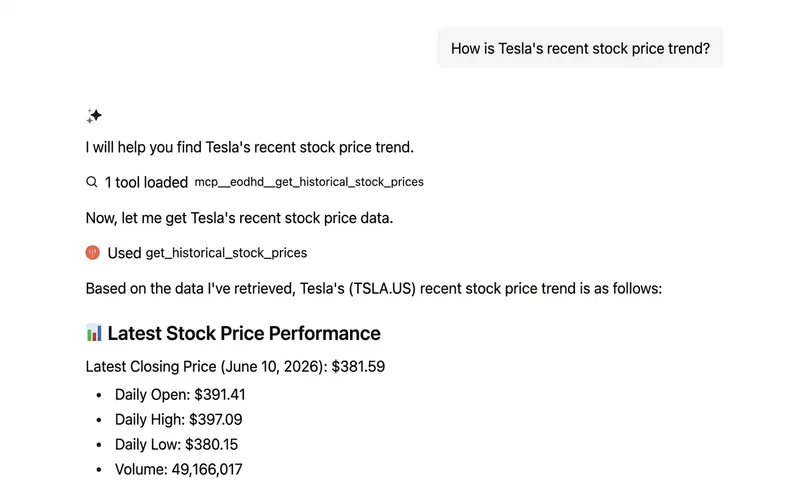
Whether you follow China's A-shares, Hong Kong H-shares, or US-listed stocks, this tool provides real-time and historical market data. You can easily look up a stock's latest price, percentage change, historical trends, dividends, stock splits, and other corporate actions, so you can stay fully informed about your investments. Beyond individual stock analysis, this tool also offers rich macroeconomic data, including US Treasury yields and commodity prices, to help you assess market sentiment and sector rotation. By aggregating company news and market sentiment analysis — especially for US stocks — you can gain deeper insight into what drives the market. For A-shares and Hong Kong stocks, you can also analyze keywords and related stocks in the news to spot industry trends and capital flows. This tool supports batch quote lookups for multiple stocks and can compare the premium or discount of Chinese concept stocks and Hong Kong stocks in the US ADR market, providing valuable context for cross-market investing. Whether you are monitoring the market regularly or quickly investigating unusual price movements, it serves as an efficient investment assistant. Please note that this tool provides data query services only and does not execute trades.

US Stock Market Analyst
This skill is designed to provide a comprehensive and professional "US Stock Market Daily Wrap-Up" for investors and traders focused on the US stock market. It offers in-depth analysis of the previous trading day's performance, helping users quickly grasp market dynamics, driving factors, and capital flows. By integrating the latest information from authoritative financial media, data platforms, and official institutions, this skill delivers key content including market indices, sector performance, macroeconomic data, market breadth, and technical analysis. Users can clearly understand major index movements, intraday trend reviews, the impact of US Treasury yields and rate cut expectations on the market, and capital rotation across various industry sectors and themes. Additionally, the report focuses on popular individual stocks such as large-cap tech stocks and AI-related concepts, covering the latest news and unusual activity, along with a detailed earnings calendar and interpretation. Users can access institutional opinions, capital flow analysis, and professional judgments on market risks and future trading opportunities. The final report is presented in a clear and concise structure, facilitating users in reviewing their investments and planning next trading day's strategy.
US Stock Radar|Indices,Sectors
3 indices, 11 sectors, stocks & events in 60s
Description
Ask 'How are US stocks today?' and get the three major indices, leading sectors (gainers and losers), key stocks, and 3 major events in 60 seconds. Expand to see all 11 sectors and a full 7-day panel when needed. Automatically detects pre-market, intraday, after-hours, and market close. Key percentage changes are recalculated, and important quotes are cross-verified where possible. Facts, inferences, and unknowns are labeled separately, with Eastern Time/Beijing Time and direct sources provided. Suitable for daily market checks, pre-market risk scans, post-market reviews, and individual stock anomaly verification. This skill is for public information research assistance only and does not constitute investment advice.
Related Skills
View allMarketSnap
There are many skills for checking market data, but only this one gives you a quote card that you can directly share. Enter a stock name, code, or "market", and it will: ① Fetch data from real-time quote APIs (not guessing prices from AI memory), with minute-accurate timestamps ② Provide a complete text overview: current price, change, turnover, turnover rate, PE/PB, market cap, 52-week position ③ Each time, give an extra institutional-style quote card (1080x1350 portrait) — large number price change visuals, indicator grid, valuation bar, 52-week range locator, deep blue gold color scheme, ready to share in group chats, Moments, or Xiaohongshu Four modes auto-detected: · Individual stock overview (default) · Multi-stock comparison (2-6 stocks, automatically highlights the best and worst performers) · Market overview (three major indices + turnover + number of advancing/declining stocks) · Detailed mode (adds recent 5-day trend + latest news) Attention to detail: · A-share/HK stocks: red for up, green for down; US stocks: green for up, red for down — automatically switches by market · Data API triple fallback chain; if all fail, it will honestly inform you, never fabricates data · Only presents data, no stock recommendations or predictions; every card includes a disclaimer Suitable for investors who check the market daily, finance group admins, and content creators who need market visuals.
ResearchA-share, HK & US Stock Quotes
Whether you follow China's A-shares, Hong Kong H-shares, or US-listed stocks, this tool provides real-time and historical market data. You can easily look up a stock's latest price, percentage change, historical trends, dividends, stock splits, and other corporate actions, so you can stay fully informed about your investments. Beyond individual stock analysis, this tool also offers rich macroeconomic data, including US Treasury yields and commodity prices, to help you assess market sentiment and sector rotation. By aggregating company news and market sentiment analysis — especially for US stocks — you can gain deeper insight into what drives the market. For A-shares and Hong Kong stocks, you can also analyze keywords and related stocks in the news to spot industry trends and capital flows. This tool supports batch quote lookups for multiple stocks and can compare the premium or discount of Chinese concept stocks and Hong Kong stocks in the US ADR market, providing valuable context for cross-market investing. Whether you are monitoring the market regularly or quickly investigating unusual price movements, it serves as an efficient investment assistant. Please note that this tool provides data query services only and does not execute trades.
US Stock Market Analyst
This skill is designed to provide a comprehensive and professional "US Stock Market Daily Wrap-Up" for investors and traders focused on the US stock market. It offers in-depth analysis of the previous trading day's performance, helping users quickly grasp market dynamics, driving factors, and capital flows. By integrating the latest information from authoritative financial media, data platforms, and official institutions, this skill delivers key content including market indices, sector performance, macroeconomic data, market breadth, and technical analysis. Users can clearly understand major index movements, intraday trend reviews, the impact of US Treasury yields and rate cut expectations on the market, and capital rotation across various industry sectors and themes. Additionally, the report focuses on popular individual stocks such as large-cap tech stocks and AI-related concepts, covering the latest news and unusual activity, along with a detailed earnings calendar and interpretation. Users can access institutional opinions, capital flow analysis, and professional judgments on market risks and future trading opportunities. The final report is presented in a clear and concise structure, facilitating users in reviewing their investments and planning next trading day's strategy.
Find your next favorite skill
Explore more curated AI skills for research, creation, and everyday work.