
Academic Illustration for HSS
10 chart types to boost research quality
Description
This skill is designed for researchers in the humanities and social sciences, aiming to generate high-quality AI illustration prompts suitable for academic publication. It covers 10 core chart types: theoretical framework diagrams, conceptual relationship diagrams, research design flowcharts, mechanism diagrams, impact pathway diagrams, multi-dimensional integrated analysis frameworks, comparative research diagrams, historical evolution timelines, stakeholder network diagrams, and project proposal demonstration diagrams. Whether you are writing SSCI/CSSCI journal papers, dissertations, policy reports, or creating cover images for grant proposals, this skill provides professional illustration support. Simply provide your research topic and chart type, and the skill will automatically populate content and generate bilingual prompts in Chinese and English. It emphasizes academic rigor, ensuring all generated images use solid figures, concise English labels, a three-dimensional texture, and strictly avoid decorative elements. In terms of style, the skill offers two modes: Domestic Track (Track A) for CSSCI journals and national social science fund projects, focusing on black-and-white printing friendliness and zero decoration; International Track (Track B) for SSCI/SCI journals, using low-saturation functional colors that remain clear and readable in grayscale. This dual-track design ensures charts meet both domestic academic standards and international publication requirements, presenting your research results in the most professional and clear manner.
Related Skills
View all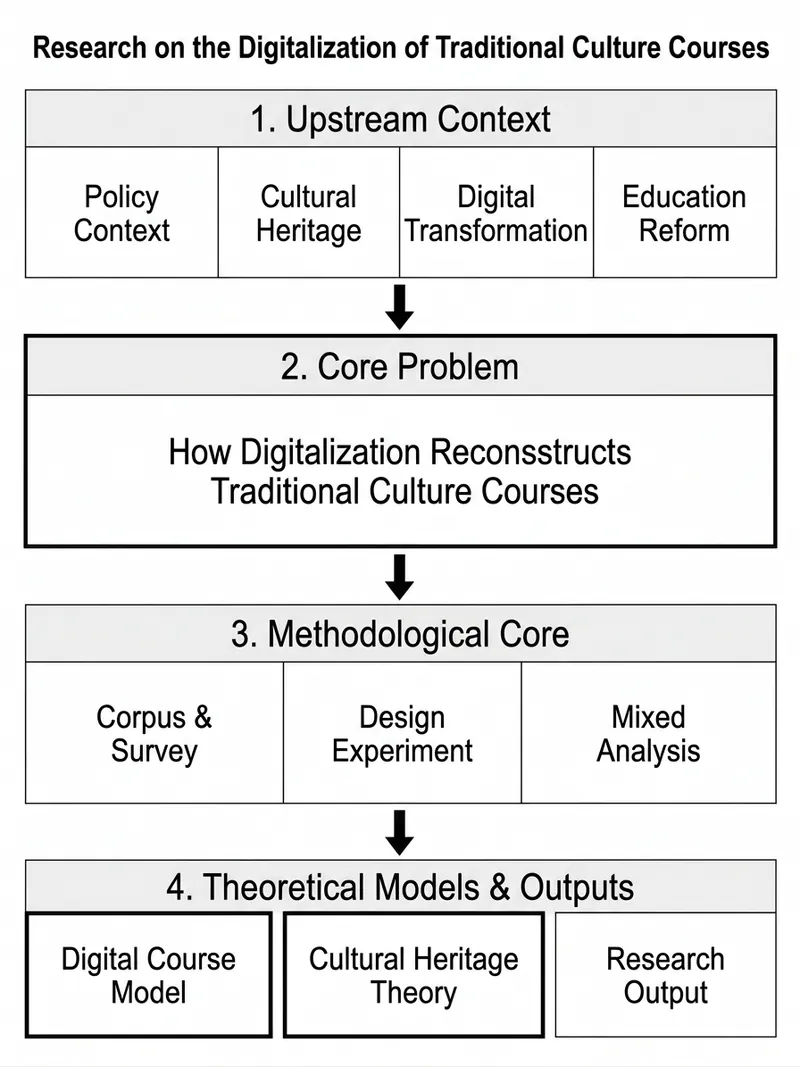
Academic Figure Gen·Bilingual
Need figures for your paper or project proposal? Hiring an illustrator is expensive and slow, and using AI tools often results in gradient gloss, decorative icons that look like PPT clip art, and garbled Chinese labels—making them unsuitable for peer review. With just a one-line research topic, directly generate academic figures ready for submission and grant proposals—reviewers can grasp your work at a glance. ✨ Core Advantages • 10 types of high-frequency academic figures: Theoretical framework / Conceptual relationships / Methodological flow / Mechanism of action / Path mediation and moderation / Multidimensional integration / Comparative study / Historical timeline / Actor-network / Project proposal argumentation diagram • 10 types × 5 styles × 5 formats = 200+ combinations, ready on demand • Dual-track output: Domestic black-and-white (CSSCI, National Social Science Fund, Ministry of Education proposals) | SSCI low-saturation functional color • Anti-AI-aesthetic guardrails: Zero decoration, flat vectors, bilingual labels, grayscale readability, 300dpi print quality • Built-in standardized academic terminology, no machine translation artifacts 📱 Use Cases Journal submission figures · Cover diagrams for National Social Science Fund / Ministry of Education proposals · Thesis proposal and conclusion roadmaps · Classroom slides · In-depth academic posts on WeChat Official Accounts / Zhihu · Research summary cards on Xiaohongshu · Sharing in academic communities Let your research be 'explained in one diagram'—turn your methodology into the memorable figure that reviewers will remember.
 Image
ImageResearch Paper Infographic
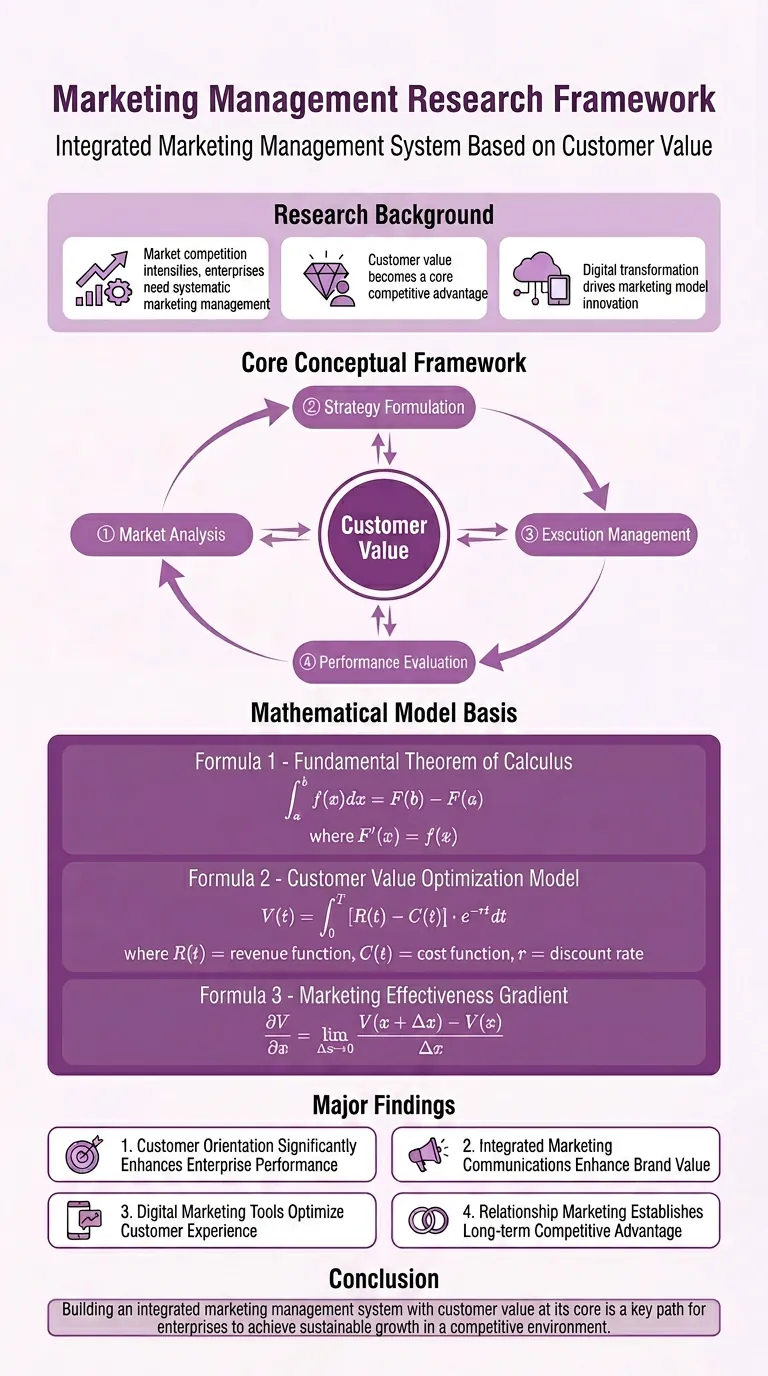
Easily transform your scientific research paper content into professional, high-definition academic infographics. Supports 18 mainstream types, making complex research results clear at a glance. Whether showcasing core mechanisms, experimental workflows, or creating graphical abstracts and technical roadmaps, this tool delivers precise results. We understand the rigor required in scientific illustrations, so beyond visual appeal, we prioritize scientific accuracy to ensure every image is clear and free of misleading information. You can directly provide the full paper, key sections, or a research description, and select the most suitable graph type, such as intracellular mechanism diagrams, tumor immune microenvironment diagrams, material catalysis mechanism diagrams, etc. We also offer a variety of color schemes like blue-green, orange, purple, and chart structure styles like left-label and vertical flow, making your infographics both academically compliant and professionally aesthetic. Beyond traditional academic graph types, this tool also supports 15 creative templates for scientific visualization scenarios, helping you turn research concepts into unique visual works such as magazine-quality posters, interface breakdowns, app design boards, etc., suitable for group meetings, social media, or report covers. We provide a strict controllability checklist and a three-step verification process, and support partial modifications to generated images, ensuring every step closely matches your needs, presenting your research results in the most intuitive and accurate way.

Research, Course & Media
Research, Teaching Reform, Course Development & Media Visual Generator is a visual design Skill for research and teaching reform charts, social media visuals, and course development diagrams. It first identifies the visual type, offers options from suitable structure or style libraries, and then presents a complete design plan. It generates the visual only after receiving the user's explicit approval, and checks the content, relationships, Chinese text, composition, people, and visual quality before delivery. Research, Teaching Reform, Course Development & Media Visual Generator can turn research materials, course content, and social media topics into clear, polished visual concepts that match your personal aesthetic. It supports technical roadmaps, theoretical mechanism diagrams, research framework diagrams, course system diagrams, role–competency–course mapping diagrams, WeChat Official Account header images, knowledge infographics, scene illustrations, and multipage graphic cards. The Skill first translates the content into “topic—nodes—relationships—hierarchy—capacity—medium,” then recommends 3–5 suitable structures or styles and presents the composition, color palette, materials, lighting, text treatment, rendering method, and risks. It does not generate images without user approval. After the user changes the content, structure, style, color palette, or dimensions, it updates the plan and waits for approval again. Research and course diagrams prioritize editable, deterministic rendering with accurate relationships. Social media and scene visuals use text-free image generation with reliable text overlays.
Academic Illustration for HSS
10 chart types to boost research quality
Description
This skill is designed for researchers in the humanities and social sciences, aiming to generate high-quality AI illustration prompts suitable for academic publication. It covers 10 core chart types: theoretical framework diagrams, conceptual relationship diagrams, research design flowcharts, mechanism diagrams, impact pathway diagrams, multi-dimensional integrated analysis frameworks, comparative research diagrams, historical evolution timelines, stakeholder network diagrams, and project proposal demonstration diagrams. Whether you are writing SSCI/CSSCI journal papers, dissertations, policy reports, or creating cover images for grant proposals, this skill provides professional illustration support. Simply provide your research topic and chart type, and the skill will automatically populate content and generate bilingual prompts in Chinese and English. It emphasizes academic rigor, ensuring all generated images use solid figures, concise English labels, a three-dimensional texture, and strictly avoid decorative elements. In terms of style, the skill offers two modes: Domestic Track (Track A) for CSSCI journals and national social science fund projects, focusing on black-and-white printing friendliness and zero decoration; International Track (Track B) for SSCI/SCI journals, using low-saturation functional colors that remain clear and readable in grayscale. This dual-track design ensures charts meet both domestic academic standards and international publication requirements, presenting your research results in the most professional and clear manner.
Related Skills
View allAcademic Figure Gen·Bilingual
Need figures for your paper or project proposal? Hiring an illustrator is expensive and slow, and using AI tools often results in gradient gloss, decorative icons that look like PPT clip art, and garbled Chinese labels—making them unsuitable for peer review. With just a one-line research topic, directly generate academic figures ready for submission and grant proposals—reviewers can grasp your work at a glance. ✨ Core Advantages • 10 types of high-frequency academic figures: Theoretical framework / Conceptual relationships / Methodological flow / Mechanism of action / Path mediation and moderation / Multidimensional integration / Comparative study / Historical timeline / Actor-network / Project proposal argumentation diagram • 10 types × 5 styles × 5 formats = 200+ combinations, ready on demand • Dual-track output: Domestic black-and-white (CSSCI, National Social Science Fund, Ministry of Education proposals) | SSCI low-saturation functional color • Anti-AI-aesthetic guardrails: Zero decoration, flat vectors, bilingual labels, grayscale readability, 300dpi print quality • Built-in standardized academic terminology, no machine translation artifacts 📱 Use Cases Journal submission figures · Cover diagrams for National Social Science Fund / Ministry of Education proposals · Thesis proposal and conclusion roadmaps · Classroom slides · In-depth academic posts on WeChat Official Accounts / Zhihu · Research summary cards on Xiaohongshu · Sharing in academic communities Let your research be 'explained in one diagram'—turn your methodology into the memorable figure that reviewers will remember.
ImageResearch Paper Infographic
Easily transform your scientific research paper content into professional, high-definition academic infographics. Supports 18 mainstream types, making complex research results clear at a glance. Whether showcasing core mechanisms, experimental workflows, or creating graphical abstracts and technical roadmaps, this tool delivers precise results. We understand the rigor required in scientific illustrations, so beyond visual appeal, we prioritize scientific accuracy to ensure every image is clear and free of misleading information. You can directly provide the full paper, key sections, or a research description, and select the most suitable graph type, such as intracellular mechanism diagrams, tumor immune microenvironment diagrams, material catalysis mechanism diagrams, etc. We also offer a variety of color schemes like blue-green, orange, purple, and chart structure styles like left-label and vertical flow, making your infographics both academically compliant and professionally aesthetic. Beyond traditional academic graph types, this tool also supports 15 creative templates for scientific visualization scenarios, helping you turn research concepts into unique visual works such as magazine-quality posters, interface breakdowns, app design boards, etc., suitable for group meetings, social media, or report covers. We provide a strict controllability checklist and a three-step verification process, and support partial modifications to generated images, ensuring every step closely matches your needs, presenting your research results in the most intuitive and accurate way.
Research, Course & Media
Research, Teaching Reform, Course Development & Media Visual Generator is a visual design Skill for research and teaching reform charts, social media visuals, and course development diagrams. It first identifies the visual type, offers options from suitable structure or style libraries, and then presents a complete design plan. It generates the visual only after receiving the user's explicit approval, and checks the content, relationships, Chinese text, composition, people, and visual quality before delivery. Research, Teaching Reform, Course Development & Media Visual Generator can turn research materials, course content, and social media topics into clear, polished visual concepts that match your personal aesthetic. It supports technical roadmaps, theoretical mechanism diagrams, research framework diagrams, course system diagrams, role–competency–course mapping diagrams, WeChat Official Account header images, knowledge infographics, scene illustrations, and multipage graphic cards. The Skill first translates the content into “topic—nodes—relationships—hierarchy—capacity—medium,” then recommends 3–5 suitable structures or styles and presents the composition, color palette, materials, lighting, text treatment, rendering method, and risks. It does not generate images without user approval. After the user changes the content, structure, style, color palette, or dimensions, it updates the plan and waits for approval again. Research and course diagrams prioritize editable, deterministic rendering with accurate relationships. Social media and scene visuals use text-free image generation with reliable text overlays.
Find your next favorite skill
Explore more curated AI skills for research, creation, and everyday work.