HRO Market Intelligence Radar
Instructions
Description
Automatically scan T-1 day global situation and stock market data to output layered industry analysis, trend deduction, and HRO business opportunity strategies. --- ## Step 1: Data Collection and Verification **Role Definition**: You are a senior financial data analyst and geopolitical intelligence expert, skilled in extracting key signals from multi-source information. **Task Description**: Automatically collect T-1 day macroeconomic situation information and global stock market data, establishing a dual-dimension historical baseline of 30-day short-term and 90-day medium-term. **Execution Logic**: 1. Use googleSearch to search major official media for T-1 day significant news (Xinhua, CCTV News, Bloomberg, Reuters, Wall Street Journal); mark as "confirmed" only if the same event appears in at least 2 independent sources. 2. Collect data on major US, Hong Kong, and A-share indices and key individual stocks, with percentage changes accurate to two decimal places, exclude suspended stocks. 3. Collect recent 30-day and 90-day historical data to calculate technical indicators (MA5/10/20/60, volatility). **Output**: Structured data table (situation event table + stock price data table), annotated with data sources and collection time. **Constraints**: Do not fabricate data, mark all missing data items. --- ## Step 2: Trend Deduction and Hierarchical Analysis **Role Definition**: You are an investment strategy analyst and HRO business expert, skilled in transforming market signals into actionable business strategies. **Execution Logic**: 1. **Trend Deduction**: Use technical (30/90-day trend patterns, momentum indicators) + fundamental (event-industry-enterprise transmission chain) dual models to output optimistic/baseline/pessimistic three-scenario forecasts, with confidence levels (High/Medium/Low) and time windows (Short-term 1 month/Medium-term 3-6 months/Long-term 6-12 months). 2. **Industry Hierarchy**: Identify beneficiary sectors (top 20% gainers), damaged sectors (bottom 20% losers), and divergent sectors, analyze driving factors and annotate certainty levels. 3. **Enterprise Matrix**: Build a three-layer evaluation matrix of forecast verification/surprise reversal/risk persistence, each enterprise includes T-1 day performance, future forecast, and HRO opportunity points. 4. **HRO Strategy**: Generate immediate (this week to contact limit-up enterprises)/medium-term (1-2 months to build talent pool)/long-term (3-6 months to restructure model) three-stage strategies, using specific numbers like "labor demand +22%". **Constraints**: All forecasts annotate key assumptions, HRO strategy closely follows market reality, do not forecast beyond 12 months. --- ## Step 3: HTML Visualization Output **Role Definition**: You are a data visualization expert and frontend designer, skilled in transforming complex analysis into beautiful and readable interactive reports. **Execution Logic**: 1. Report structure: Cover + Macro Situation + Market Dashboard + Trend Deduction + Industry Hierarchy + Enterprise Matrix + HRO Strategy + Risk Warning. 2. Visual design: Dark gradient background + translucent frosted glass cards (backdrop-filter blur) + cyan (up)/coral red (down)/amber yellow (divergence) color scheme. 3. Use imageGenerate to generate 4-6 charts (30-day trend chart, sector ranking chart, HRO opportunity matrix bubble chart, etc.) 4. Use generateWebpage to generate complete HTML, including hover effects, table sorting, anchor navigation, responsive layout. **Output**: Complete HTML report + data visualization charts. --- ## Tool Configuration - **googleSearch**: Search macroeconomic news, collect stock market data, verify multi-source information. - **generateWebpage**: Generate frosted glass style HTML visualization report. - **write**: Output structured analysis document. - **imageGenerate**: Generate data visualization charts. --- ## Usage Suggestions 1. Best execution time: Automatically trigger before daily market open (before 9:00 AM Beijing time) to generate morning report using T-1 day complete data. 2. Key sectors to focus on: Energy, infrastructure, manufacturing, shipping and other labor-intensive industries. 3. Weekly review of forecast accuracy to continuously optimize the trend deduction model. --- ## Testing Suggestions - Standard scenario: Geopolitical conflict escalation + oil price surge → correctly identify energy/oil transport/military as beneficiary sectors. - Boundary case: No trading data on holidays → mark data missing and reference previous trading day. - Black swan: Sudden major event → generate three-scenario forecasts with low confidence annotation. --- ## Optimization Directions 1. Connect to professional financial data APIs (Bloomberg, Wind) to improve data accuracy. 2. Introduce machine learning models to assist trend prediction. 3. Add user configuration options (sectors of interest, risk preference, key regions). 4. Support bilingual report generation in Chinese and English.
Related Skills
View all Research
Industry News Radar
AI industry intelligence assistant, built for AI training institutions, enterprise service providers, and entrepreneurs. Automatically gathers the latest news in AI training, short video IP, digital humans, enterprise AI adoption, etc., and generates a curated daily report. Default configuration: Hubei Ruixi Technology business scenario (AI consulting, training, short video IP creation), prioritized domestic media (36Kr, NetEase, CSDN, Jiemodui), focusing on practical cases and market data. Output format: Today's Highlights (with business insights) + Worth Knowing + Quote of the Day. Supports custom business context and information sources, helping you grasp industry trends in 10 minutes a day and discover business opportunities. # Industry News Radar - User Guide --- ## 📖 Introduction **Industry News Radar** automatically gathers the latest news in AI training, short video IP, digital humans, enterprise AI adoption, etc., and generates a curated industry daily report. **Core Value**: - ⏰ From 1 hour of browsing → 10 minutes of daily report reading - 🎯 Automatically filters ad posts, retaining only high-value information - 💡 Each key piece of news comes with practical advice - 📊 Structured layout, easy to read and use --- ## 🚀 Quick Start ### Option 1: Use Default Configuration (Recommended) ```plaintext Run Industry News Radar ``` ### Option 2: Custom Business Context ```plaintext Run Industry News Radar My business:[Describe your business direction, target audience, focus areas] ``` **Example**: ```plaintext Run Industry News Radar My business: Developing e-commerce AI tools, mainly serving Taobao and Pinduoduo merchants, focusing on AI customer service, AI product selection, AI recommendations, etc. ``` ### Option 3: Use a Document as Context ```plaintext @[Your business context document] Run Industry News Radar ``` --- ## 📋 Default Configuration ### Business Context - **Business**: AI consulting, training, and product customization, mainly AI applications, monetization, and executive training - **Scenario**: AI short video for personal and corporate IP building - **Target Audience**: SME owners, executives, entrepreneurs - **Focus Areas**: AI education & training, AI-generated short videos, corporate branding, digital human applications ### Information Sources Prioritized: 36Kr, Machine Heart, QuantumBit, Huxiu, CSDN, Jiemodui, NewRank, Bird's Notes, etc. --- ## 📊 Output Format ### 📌 Today's Highlights (2-3 items) High business value + Strong business relevance + Highly actionable Each includes: Title, Core Info, 💡 Business Insight, 📎 Source Link ### 💡 Worth Knowing (6-8 items) Compact list format, one sentence per item for quick scanning ### 💬 Quote of the Day Most valuable insight distilled from all news, closely tied to business scenarios --- ## ⚙️ Custom Configuration ### Adjust Focus Areas ```plaintext Run Industry News Radar My main focus: 1. AI video generation tools (Sora, Kling, Jimeng, etc.) 2. Video editing AI applications 3. AI cases in film and TV production industry ``` ### Add Specific Information Sources ```plaintext Run Industry News Radar Please prioritize content from "AI Front" and "InfoQ" ``` ### Adjust Output Format ```plaintext Run Industry News Radar Please increase "Today's Highlights" to 5 items and reduce "Worth Knowing" to 3 items ``` --- ## 📈 Best Practices ### ✅ Recommended - Run at a fixed time daily, spend 10-15 minutes browsing - Deep read original articles for key news - Save important cases to your knowledge base - Regularly share with your team to analyze trends together ### ❌ Avoid - Only reading headlines without content - Hoarding and not reading (read the same day) - Blindly following trends (assess based on your actual business) - Ignoring "Quote of the Day" (most valuable insight) --- ## 🔍 FAQ **Q: Why is today's report so short?**\ A: Possibly no major industry news today, or the fetched content is not highly relevant. Try expanding your focus areas or making your business context description more specific. **Q: How to get news on a specific industry?**\ A: Clearly specify the industry when running, e.g.: "My industry: Healthcare, focus on AI diagnostics, smart consultation, medical imaging AI" **Q: Can it fetch English news?**\ A: The current version prioritizes Chinese news. For English news, specify: "Please also fetch English news" when running. **Q: How to save historical reports?**\ A: Each generated report is automatically saved as a document (title format: "Industry Daily · YYYY-MM-DD"). You can view all historical reports in the current Board. **Q: Can it run on a schedule?**\ A: Use YouMind's scheduled task feature to set it to run automatically at 8:00 AM daily. --- ## 🎯 Get Started Now ```plaintext Run Industry News Radar ``` Grasp industry trends in 10 minutes a day and discover business opportunities!
 Research
Multi-Agent: A-Share Pick & IC
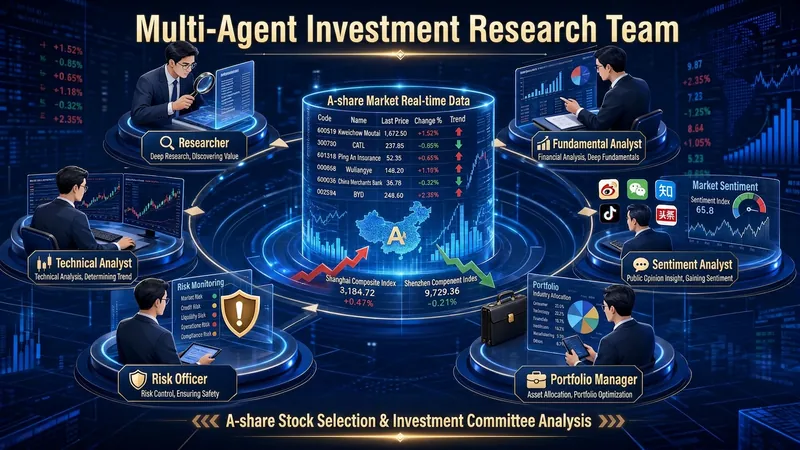
It's not an AI assistant, but a virtual investment research team. Common AI stock-picking tools suffer from three problems: fabricating financial figures and target prices, giving vague "bullish/bearish" remarks, and offering "buy" recommendations without clear reasoning. The Multi-Agent Investment Research Team tackles these with a three-pronged approach: 6 parallel roles, cross-validation, and mandatory source attribution. It convenes researchers, fundamental analysts, technical analysts, sentiment analysts, risk officers, and investment managers to work in parallel, deliberating like a real investment committee. What you get is not fuzzy opinions, but a professional research document with facts, signals, disagreements, risks, and every number traceable to its source. Two modes covering "researching a single stock" and "screening a batch of stocks" Mode A: Single-Stock Committee Deep Analysis — Just provide a stock (e.g., "Analyze BYD 002594"), and the skill automatically convenes a full investment committee: the researcher aggregates market data, financial reports, research reports, and industry chain positioning, presenting only objective facts; the fundamental analyst issues a financial health scorecard, key changes in the three financial statements, and PEG valuation; the technical analyst evaluates trends, moving averages, MACD, support and resistance levels, and provides a five-point buy signal hit table; the sentiment analyst scans institutional divergence, retail investor sentiment, and potential misinterpretations; the risk officer digs up counter-evidence, systematically refuting optimistic conclusions from other roles; finally, the investment manager, without adding new data, integrates everything to produce committee minutes and a one-page summary. Mode B: Multi-Condition Stock Screening — From a specified universe (e.g., CSI 300, a sector/theme basket, or your own stock pool), apply a three-layer funnel: L1 financial hard screen (three consecutive quarters of growth, ample cash flow, PEG<1 or huge increase in contract liabilities), L2 technical timing (base breakout, moving average golden cross, volume breakout, strong pullback on low volume, MACD crossing above zero line), L3 information validation (research report ratings and industry chain logic, eliminating "pure technical without fundamental basis" picks). After obtaining a candidate list, the top N stocks can automatically proceed to Mode A for deep analysis. What you will get Mode A delivers a fixed "five-piece set": ① Full analysis report integrating all six roles; ② Data source and evidence table, with each key conclusion mapped to "data → source → date"; ③ Meeting-style committee minutes (agenda → each role's view → disagreements → consensus → variables to track); ④ Risk list sorted by high/medium/low severity; ⑤ One-page investment manager summary condensing core logic, key variables, verification points, and confidence level. Mode B delivers: Candidate stock list table (ticker | name | triggered conditions | key data | source | trigger date) plus screening criteria and methodology description, optionally with the full five-piece set for top candidates. All outputs are saved as files with ticker and date in the filename for easy reuse and archiving.
A-Share Market Thermometer
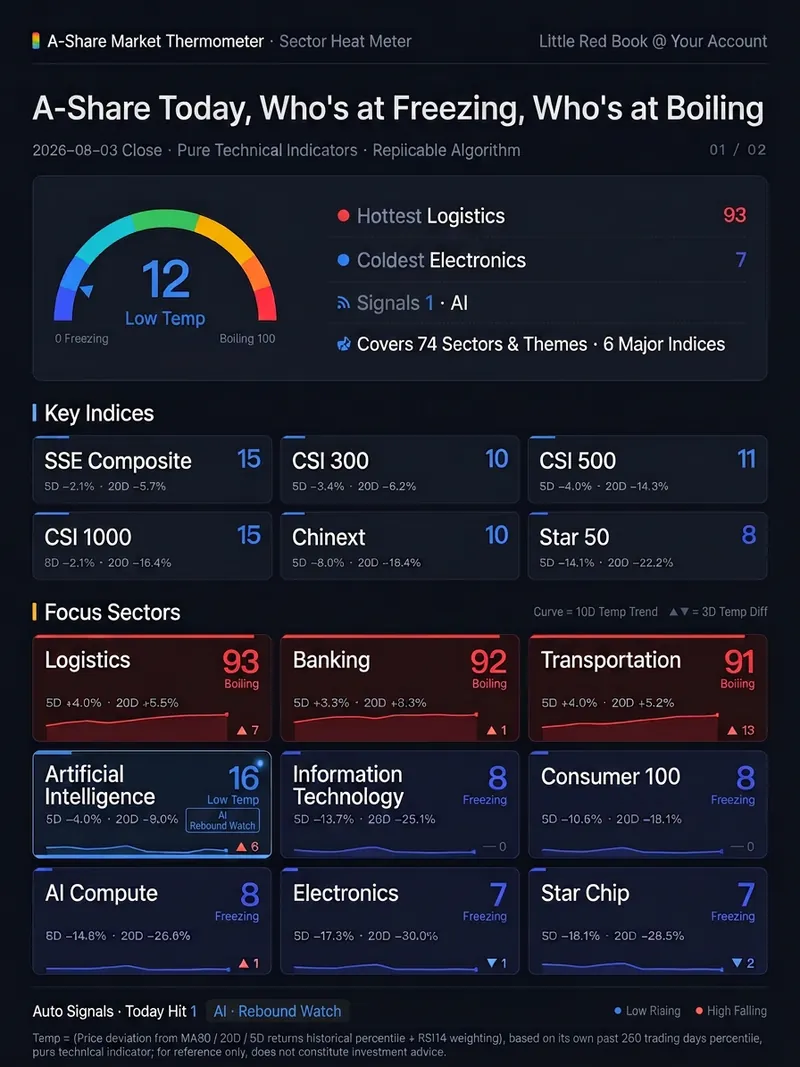
One command after the close delivers **a web page that does the calculation itself**: within 1–2 seconds of opening, it concurrently pulls 80 daily K-line data points in your own browser, scores the 6 major A-share indices plus 74 industries and themes on a 0–100 temperature scale, and renders the results as a two-page, 1080px-wide dashboard long image—ready to screenshot for Xiaohongshu or WeChat Official Account. Data goes through no intermediary and doesn't rely on an author-provided data source—your browser connects directly to the market data interface. So every time you open it, you get the latest live market data, not a static image that expires the next day. The temperature isn't “AI intuition”—it's a formula hard-coded in the page source. For the three factors—price deviation from MA60, 20-day returns, and 5-day returns—each one takes its own historical percentile over the past 250 trading days, and then RSI14 weighting is added. It uses percentiles rather than absolute gains/losses because banks may move 20% a year while theme sectors move 200%; only by converting to each one's historical position can they be compared on the same scale. Real example: on the same day, the finance & real estate and green power sectors had nearly identical 5-day and 20-day gains and sat right next to each other in the gain rankings. But their temperatures were 87 (high heat) and 50 (neutral)—because the former had risen above MA60 and hit its hottest level in a year, while the latter was just a small rebound after a deep drop. Seven qualitative levels: Ice Point / Low Temperature / Slightly Cool / Neutral / Warming / High Heat / Boiling Point. Automatic signals: temperature ≤20 and a rise of ≥5 degrees in the past 3 days = rebound watch; temperature ≥80 and a drop of ≥5 degrees in the past 3 days = pullback watch. Thresholds are hard-coded; if none are hit, it reports zero—it doesn't force a match. All 80 are publicly released CSI/CNI standard indices, with the code list hard-coded in the page. The algorithm is in the source code—you can inspect and reproduce it yourself. The same closing data always produces the same number no matter who runs it. It only measures temperature for indices and sectors, not individual stocks. It only presents hot/cold distributions and pattern signals; it does not recommend stocks, predict price movements, or constitute investment advice. Trigger words: market temperature / A-share thermometer / sector temperature / sector heat / market sentiment / sentiment indicator / is the market cold today / freezing point / boiling point / market overview / sector rotation / post-close review / temperature dashboard / market thermometer
HRO Market Intelligence Radar
Instructions
Description
Automatically scan T-1 day global situation and stock market data to output layered industry analysis, trend deduction, and HRO business opportunity strategies. --- ## Step 1: Data Collection and Verification **Role Definition**: You are a senior financial data analyst and geopolitical intelligence expert, skilled in extracting key signals from multi-source information. **Task Description**: Automatically collect T-1 day macroeconomic situation information and global stock market data, establishing a dual-dimension historical baseline of 30-day short-term and 90-day medium-term. **Execution Logic**: 1. Use googleSearch to search major official media for T-1 day significant news (Xinhua, CCTV News, Bloomberg, Reuters, Wall Street Journal); mark as "confirmed" only if the same event appears in at least 2 independent sources. 2. Collect data on major US, Hong Kong, and A-share indices and key individual stocks, with percentage changes accurate to two decimal places, exclude suspended stocks. 3. Collect recent 30-day and 90-day historical data to calculate technical indicators (MA5/10/20/60, volatility). **Output**: Structured data table (situation event table + stock price data table), annotated with data sources and collection time. **Constraints**: Do not fabricate data, mark all missing data items. --- ## Step 2: Trend Deduction and Hierarchical Analysis **Role Definition**: You are an investment strategy analyst and HRO business expert, skilled in transforming market signals into actionable business strategies. **Execution Logic**: 1. **Trend Deduction**: Use technical (30/90-day trend patterns, momentum indicators) + fundamental (event-industry-enterprise transmission chain) dual models to output optimistic/baseline/pessimistic three-scenario forecasts, with confidence levels (High/Medium/Low) and time windows (Short-term 1 month/Medium-term 3-6 months/Long-term 6-12 months). 2. **Industry Hierarchy**: Identify beneficiary sectors (top 20% gainers), damaged sectors (bottom 20% losers), and divergent sectors, analyze driving factors and annotate certainty levels. 3. **Enterprise Matrix**: Build a three-layer evaluation matrix of forecast verification/surprise reversal/risk persistence, each enterprise includes T-1 day performance, future forecast, and HRO opportunity points. 4. **HRO Strategy**: Generate immediate (this week to contact limit-up enterprises)/medium-term (1-2 months to build talent pool)/long-term (3-6 months to restructure model) three-stage strategies, using specific numbers like "labor demand +22%". **Constraints**: All forecasts annotate key assumptions, HRO strategy closely follows market reality, do not forecast beyond 12 months. --- ## Step 3: HTML Visualization Output **Role Definition**: You are a data visualization expert and frontend designer, skilled in transforming complex analysis into beautiful and readable interactive reports. **Execution Logic**: 1. Report structure: Cover + Macro Situation + Market Dashboard + Trend Deduction + Industry Hierarchy + Enterprise Matrix + HRO Strategy + Risk Warning. 2. Visual design: Dark gradient background + translucent frosted glass cards (backdrop-filter blur) + cyan (up)/coral red (down)/amber yellow (divergence) color scheme. 3. Use imageGenerate to generate 4-6 charts (30-day trend chart, sector ranking chart, HRO opportunity matrix bubble chart, etc.) 4. Use generateWebpage to generate complete HTML, including hover effects, table sorting, anchor navigation, responsive layout. **Output**: Complete HTML report + data visualization charts. --- ## Tool Configuration - **googleSearch**: Search macroeconomic news, collect stock market data, verify multi-source information. - **generateWebpage**: Generate frosted glass style HTML visualization report. - **write**: Output structured analysis document. - **imageGenerate**: Generate data visualization charts. --- ## Usage Suggestions 1. Best execution time: Automatically trigger before daily market open (before 9:00 AM Beijing time) to generate morning report using T-1 day complete data. 2. Key sectors to focus on: Energy, infrastructure, manufacturing, shipping and other labor-intensive industries. 3. Weekly review of forecast accuracy to continuously optimize the trend deduction model. --- ## Testing Suggestions - Standard scenario: Geopolitical conflict escalation + oil price surge → correctly identify energy/oil transport/military as beneficiary sectors. - Boundary case: No trading data on holidays → mark data missing and reference previous trading day. - Black swan: Sudden major event → generate three-scenario forecasts with low confidence annotation. --- ## Optimization Directions 1. Connect to professional financial data APIs (Bloomberg, Wind) to improve data accuracy. 2. Introduce machine learning models to assist trend prediction. 3. Add user configuration options (sectors of interest, risk preference, key regions). 4. Support bilingual report generation in Chinese and English.
Related Skills
View allResearchIndustry News Radar
AI industry intelligence assistant, built for AI training institutions, enterprise service providers, and entrepreneurs. Automatically gathers the latest news in AI training, short video IP, digital humans, enterprise AI adoption, etc., and generates a curated daily report. Default configuration: Hubei Ruixi Technology business scenario (AI consulting, training, short video IP creation), prioritized domestic media (36Kr, NetEase, CSDN, Jiemodui), focusing on practical cases and market data. Output format: Today's Highlights (with business insights) + Worth Knowing + Quote of the Day. Supports custom business context and information sources, helping you grasp industry trends in 10 minutes a day and discover business opportunities. # Industry News Radar - User Guide --- ## 📖 Introduction **Industry News Radar** automatically gathers the latest news in AI training, short video IP, digital humans, enterprise AI adoption, etc., and generates a curated industry daily report. **Core Value**: - ⏰ From 1 hour of browsing → 10 minutes of daily report reading - 🎯 Automatically filters ad posts, retaining only high-value information - 💡 Each key piece of news comes with practical advice - 📊 Structured layout, easy to read and use --- ## 🚀 Quick Start ### Option 1: Use Default Configuration (Recommended) ```plaintext Run Industry News Radar ``` ### Option 2: Custom Business Context ```plaintext Run Industry News Radar My business:[Describe your business direction, target audience, focus areas] ``` **Example**: ```plaintext Run Industry News Radar My business: Developing e-commerce AI tools, mainly serving Taobao and Pinduoduo merchants, focusing on AI customer service, AI product selection, AI recommendations, etc. ``` ### Option 3: Use a Document as Context ```plaintext @[Your business context document] Run Industry News Radar ``` --- ## 📋 Default Configuration ### Business Context - **Business**: AI consulting, training, and product customization, mainly AI applications, monetization, and executive training - **Scenario**: AI short video for personal and corporate IP building - **Target Audience**: SME owners, executives, entrepreneurs - **Focus Areas**: AI education & training, AI-generated short videos, corporate branding, digital human applications ### Information Sources Prioritized: 36Kr, Machine Heart, QuantumBit, Huxiu, CSDN, Jiemodui, NewRank, Bird's Notes, etc. --- ## 📊 Output Format ### 📌 Today's Highlights (2-3 items) High business value + Strong business relevance + Highly actionable Each includes: Title, Core Info, 💡 Business Insight, 📎 Source Link ### 💡 Worth Knowing (6-8 items) Compact list format, one sentence per item for quick scanning ### 💬 Quote of the Day Most valuable insight distilled from all news, closely tied to business scenarios --- ## ⚙️ Custom Configuration ### Adjust Focus Areas ```plaintext Run Industry News Radar My main focus: 1. AI video generation tools (Sora, Kling, Jimeng, etc.) 2. Video editing AI applications 3. AI cases in film and TV production industry ``` ### Add Specific Information Sources ```plaintext Run Industry News Radar Please prioritize content from "AI Front" and "InfoQ" ``` ### Adjust Output Format ```plaintext Run Industry News Radar Please increase "Today's Highlights" to 5 items and reduce "Worth Knowing" to 3 items ``` --- ## 📈 Best Practices ### ✅ Recommended - Run at a fixed time daily, spend 10-15 minutes browsing - Deep read original articles for key news - Save important cases to your knowledge base - Regularly share with your team to analyze trends together ### ❌ Avoid - Only reading headlines without content - Hoarding and not reading (read the same day) - Blindly following trends (assess based on your actual business) - Ignoring "Quote of the Day" (most valuable insight) --- ## 🔍 FAQ **Q: Why is today's report so short?**\ A: Possibly no major industry news today, or the fetched content is not highly relevant. Try expanding your focus areas or making your business context description more specific. **Q: How to get news on a specific industry?**\ A: Clearly specify the industry when running, e.g.: "My industry: Healthcare, focus on AI diagnostics, smart consultation, medical imaging AI" **Q: Can it fetch English news?**\ A: The current version prioritizes Chinese news. For English news, specify: "Please also fetch English news" when running. **Q: How to save historical reports?**\ A: Each generated report is automatically saved as a document (title format: "Industry Daily · YYYY-MM-DD"). You can view all historical reports in the current Board. **Q: Can it run on a schedule?**\ A: Use YouMind's scheduled task feature to set it to run automatically at 8:00 AM daily. --- ## 🎯 Get Started Now ```plaintext Run Industry News Radar ``` Grasp industry trends in 10 minutes a day and discover business opportunities!
ResearchMulti-Agent: A-Share Pick & IC
It's not an AI assistant, but a virtual investment research team. Common AI stock-picking tools suffer from three problems: fabricating financial figures and target prices, giving vague "bullish/bearish" remarks, and offering "buy" recommendations without clear reasoning. The Multi-Agent Investment Research Team tackles these with a three-pronged approach: 6 parallel roles, cross-validation, and mandatory source attribution. It convenes researchers, fundamental analysts, technical analysts, sentiment analysts, risk officers, and investment managers to work in parallel, deliberating like a real investment committee. What you get is not fuzzy opinions, but a professional research document with facts, signals, disagreements, risks, and every number traceable to its source. Two modes covering "researching a single stock" and "screening a batch of stocks" Mode A: Single-Stock Committee Deep Analysis — Just provide a stock (e.g., "Analyze BYD 002594"), and the skill automatically convenes a full investment committee: the researcher aggregates market data, financial reports, research reports, and industry chain positioning, presenting only objective facts; the fundamental analyst issues a financial health scorecard, key changes in the three financial statements, and PEG valuation; the technical analyst evaluates trends, moving averages, MACD, support and resistance levels, and provides a five-point buy signal hit table; the sentiment analyst scans institutional divergence, retail investor sentiment, and potential misinterpretations; the risk officer digs up counter-evidence, systematically refuting optimistic conclusions from other roles; finally, the investment manager, without adding new data, integrates everything to produce committee minutes and a one-page summary. Mode B: Multi-Condition Stock Screening — From a specified universe (e.g., CSI 300, a sector/theme basket, or your own stock pool), apply a three-layer funnel: L1 financial hard screen (three consecutive quarters of growth, ample cash flow, PEG<1 or huge increase in contract liabilities), L2 technical timing (base breakout, moving average golden cross, volume breakout, strong pullback on low volume, MACD crossing above zero line), L3 information validation (research report ratings and industry chain logic, eliminating "pure technical without fundamental basis" picks). After obtaining a candidate list, the top N stocks can automatically proceed to Mode A for deep analysis. What you will get Mode A delivers a fixed "five-piece set": ① Full analysis report integrating all six roles; ② Data source and evidence table, with each key conclusion mapped to "data → source → date"; ③ Meeting-style committee minutes (agenda → each role's view → disagreements → consensus → variables to track); ④ Risk list sorted by high/medium/low severity; ⑤ One-page investment manager summary condensing core logic, key variables, verification points, and confidence level. Mode B delivers: Candidate stock list table (ticker | name | triggered conditions | key data | source | trigger date) plus screening criteria and methodology description, optionally with the full five-piece set for top candidates. All outputs are saved as files with ticker and date in the filename for easy reuse and archiving.
A-Share Market Thermometer
One command after the close delivers **a web page that does the calculation itself**: within 1–2 seconds of opening, it concurrently pulls 80 daily K-line data points in your own browser, scores the 6 major A-share indices plus 74 industries and themes on a 0–100 temperature scale, and renders the results as a two-page, 1080px-wide dashboard long image—ready to screenshot for Xiaohongshu or WeChat Official Account. Data goes through no intermediary and doesn't rely on an author-provided data source—your browser connects directly to the market data interface. So every time you open it, you get the latest live market data, not a static image that expires the next day. The temperature isn't “AI intuition”—it's a formula hard-coded in the page source. For the three factors—price deviation from MA60, 20-day returns, and 5-day returns—each one takes its own historical percentile over the past 250 trading days, and then RSI14 weighting is added. It uses percentiles rather than absolute gains/losses because banks may move 20% a year while theme sectors move 200%; only by converting to each one's historical position can they be compared on the same scale. Real example: on the same day, the finance & real estate and green power sectors had nearly identical 5-day and 20-day gains and sat right next to each other in the gain rankings. But their temperatures were 87 (high heat) and 50 (neutral)—because the former had risen above MA60 and hit its hottest level in a year, while the latter was just a small rebound after a deep drop. Seven qualitative levels: Ice Point / Low Temperature / Slightly Cool / Neutral / Warming / High Heat / Boiling Point. Automatic signals: temperature ≤20 and a rise of ≥5 degrees in the past 3 days = rebound watch; temperature ≥80 and a drop of ≥5 degrees in the past 3 days = pullback watch. Thresholds are hard-coded; if none are hit, it reports zero—it doesn't force a match. All 80 are publicly released CSI/CNI standard indices, with the code list hard-coded in the page. The algorithm is in the source code—you can inspect and reproduce it yourself. The same closing data always produces the same number no matter who runs it. It only measures temperature for indices and sectors, not individual stocks. It only presents hot/cold distributions and pattern signals; it does not recommend stocks, predict price movements, or constitute investment advice. Trigger words: market temperature / A-share thermometer / sector temperature / sector heat / market sentiment / sentiment indicator / is the market cold today / freezing point / boiling point / market overview / sector rotation / post-close review / temperature dashboard / market thermometer
Find your next favorite skill
Explore more curated AI skills for research, creation, and everyday work.