
Rapid Industry Understanding
Systematic 8-dimension industry report
Rapid Industry Understanding
Systematic 8-dimension industry report
Showcase
Description
📋 Usage Guide This Skill is an industry research engine based on McKinsey methodology, using the eight-dimension framework from Xiao Jing's "How to Quickly Understand an Industry". Tell it an industry name, and it produces a systematic research report. —————————————————————————————— 🚀 Basic Usage Just tell me the industry you want to research—the more specific, the better: a. "Analyze the solid-state battery industry" b. "Look at the humanoid robot supply chain from an entrepreneurial perspective" c. "Is the solar industry still investable now?" You can optionally provide three details (if missing, I'll use defaults): 1. Industry name: be specific, e.g., "perovskite solar" instead of "new energy"—required; 2. Goal: investment / career / entrepreneurship / competitive analysis / education, default: investment; 3. Region: China market / global / US / Southeast Asia..., default: China market; —————————————————————————————— ⚙️ What it does automatically? The entire process has 4 stages: 1. Multi-round web searches for market size/growth/penetration rate, supply chain, competitive landscape, moat evidence, policy, valuation—every conclusion has a source and timestamp, never fabricated; 2. Lifecycle positioning: use penetration rate to determine if the industry is in introduction/growth/maturity/decline—different stages have completely different research focuses; 3. Eight-dimension deep dive: business model → market size → moat (forced deep dive into dynamic trends) → competitive landscape (forced scoring on each of Porter's Five Forces) → valuation → PEST → business cycle; 4. Contrarian check: distinguish market priced-in consensus from overlooked real issues, and provide decision recommendations; —————————————————————————————— 📊 What it outputs? A professional research report in Markdown format, structured as: 1. ⚡ 30-second verdict — stage / core profit logic / biggest opportunity / biggest risk / one-sentence conclusion; 2. Research object and boundary definition; 3. Lifecycle positioning (with penetration rate data); 4. Eight-dimension analysis (moat includes dynamic trend table, Porter's Five Forces scoring table); 5. Contrarian check; 6. Conclusion and decision recommendations; 7. Key risk list; 8. Data sources and time notes; —————————————————————————————— 🔑 Two Core Highlights 1. Forced deep dive on moat: not just the type of barrier, but must answer "has it widened or narrowed in the past 2-3 years?" using market share/gross margin/pricing power data; 2. Porter's Five Forces scored individually: all five forces scored to avoid shortcuts, determining who has the strongest bargaining power now and whether the landscape is favorable or deteriorating for leaders; —————————————————————————————— ⏱️ Time Approximately 2-4 minutes, due to multiple rounds of search + dimension-by-dimension analysis + report writing —————————————————————————————— 🧩 Subsequent Extensions After the report is generated, you can continue with two specialized analyses (requires manual confirmation, won't run automatically): 1. "Unchain to find bottlenecks": identify physical bottlenecks in the supply chain that can't be bypassed when trends scale, locking in true beneficiary targets; 2. "DCF valuation": run a full discounted cash flow model for a specific company within the industry; —————————————————————————————— ▶️ Want to try? Just tell me an industry name, e.g., "Take a look at the AI agent industry from an entrepreneurial perspective" or "What's the situation with the hydrogen energy supply chain?"
Recommended by
Dancang
Why we love this skill
This skill embodies the essence of McKinsey-style industry research. Through a 'search-then-judge' approach and an eight-dimension analysis framework, it ensures each report is based on the latest data, providing deep insights and decision-making advice, not just generalities.
Related Skills
View all
Objective Industry Research
An essential tool for investors. In-depth research to support decisions, but no judgments — very important, and those in the know understand. Author: Former engineer/entrepreneur, now a primary market investor, reviewed over 10,000 pitch decks, and has had in-depth discussions with more than 1,000 companies. Usage: Trigger via direct conversation. Example: "Research the triacetate cellulose (TAC film) industry." → The skill will automatically identify and activate. What it does: 1. Automatically identify input type and define research scope. 2. Phase 1: 3-5 search rounds, output a 1,500-word quick panoramic scan (data tables + industry chain + key players + drivers/bottlenecks + information gaps). 3. Phase 2: After you reply "Continue," output a full report covering 7 sections and 21 dimensions (5,000-15,000 words). 4. All output is pure facts, without judgments like "Is it worth investing?" --- # industry-research — In-Depth Industry Research ## Core Principles ## Division of Work ## Step 1: Identify and Define Scope ## Step 2: Phase 1 — Quick Panoramic Scan ### Phase 1 Output Structure ## Step 3: Phase 2 — Complete In-Depth Report ### Phase 1 Output Structure #### Part 1: Macro Overview #### Part 2: Market and Scale #### Part 3: Industry Chain Panorama #### Part 4: Global Perspective #### Part 5: Policy and Regulation #### Part 6: Capital and Market #### Part 7: In-Depth Understanding ## Data Quality Marking ## Phase 2 Parallel Search Strategy (Optional) ## Pre-Output Check
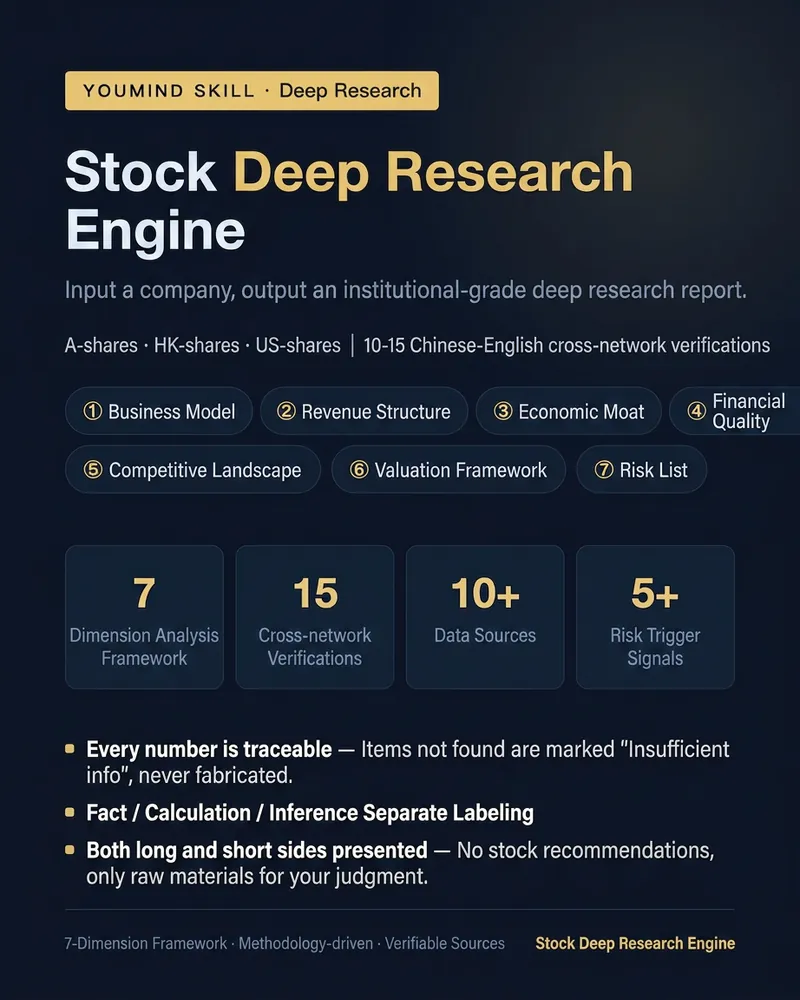
Deep Stock Research Engine
Not a news summary, but an individual stock research report with a methodological framework. Enter a company (A-share/H-share/US stock name or code), and it will perform 10-15 bilingual web searches to produce a report based on a seven-dimension framework: ① Business Model – where money comes from and goes, with a "translated into plain language" version ② Revenue Structure – breakdown by business, growth engines and drags ③ Moat – mandatory answer on widening or narrowing, using market share, gross margin, and pricing power ④ Financial Quality – cash flow vs profit alignment, changes in receivables, inventory, and goodwill ⑤ Competitive Landscape – competitor comparison table and concentration direction ⑥ Valuation Framework – only data and calculation framework, no judgment of over/undervaluation ⑦ Risk List – sorted by impact, each with verifiable trigger signals Each report includes: a one-page bull/bear summary (with substantial evidence on both sides), a next-quarter tracking list, and data sources for each point. Three iron rules: · Each key number is traceable to official filings or authoritative media; if not found, labeled 'insufficient information', never fabricated · Facts, calculations, and inferences are labeled separately · No stock price predictions, no target prices, no buy/sell advice – even for 'should I buy', only bull/bear evidence is given Supports three perspectives: Understand the Business (default), Financial Checkup, and Company Comparison. Suitable for investment researchers, financial content creators, and serious investors who want to systematically understand a company.
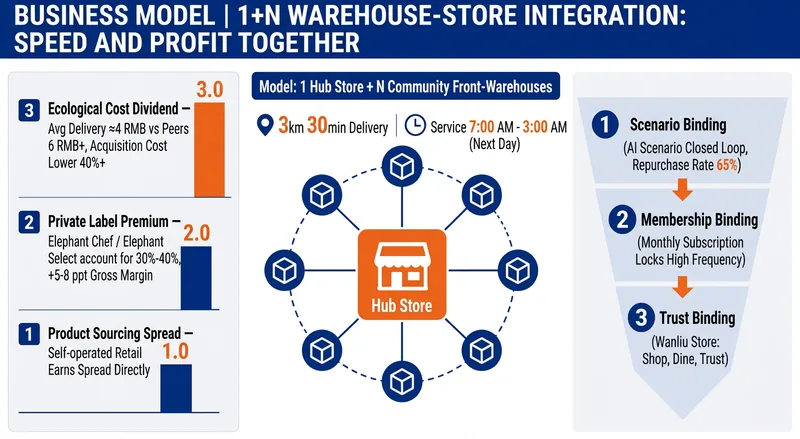
Research Studio: Report + PPT
Turn a company, industry, or competitor into a research report and PPT deliverable for management presentations and strategic decisions. The research covers strategic positioning, business models, operational detail, key data, the competitive landscape, supply chains, core strengths, and future capability priorities. It also considers industry trends, market size, risks and controversies, and practical competitive tactics—helping you understand how the business wins, whether it can scale, and where it should go next. The skill organizes public research into an evidence chain with dates, data definitions, sources, and credibility notes. It takes an opinion-led approach to distill strategic claims and decision-ready talking points for presentations. The final deliverable is a complete enterprise case study report with data sources and disclaimers, along with a consulting-style PPT outline and presentation built around a single thesis, making complex information easier to explain in about 15 minutes. From the outline through the visual presentation, you can confirm the narrative angle, audience depth, page count, and design style before completing the report and presentation. It is suited to corporate strategy, investment research, consulting projects, industry analysis, and competitive benchmarking. After completion, you can continue developing a specific dimension, make cross-comparisons, adjust the framework or visual style, or research a new subject.
Information
- Version
- v22
- Last updated
- Runtime credits
- Usage-based
- Models
- Auto