Health Checkup Report Guide
Turn lab flags into clear next steps
Health Checkup Report Guide
Turn lab flags into clear next steps
Showcase
Description
When you receive a health checkup report, it can be packed with numbers and up and down arrows—while the three or five things that really matter are easy to miss. 【Health Checkup Report Guide】 explains each item step by step: “指标 → what a high or low result usually means → whether you should retest → what to ask your doctor.” It then sorts the results into three levels: handle this week, review at your next checkup, or probably no action needed. It also separately explains findings that can easily cause unnecessary worry, such as mild fatty liver, simple liver cysts, and physiological murmurs. Firm rules: it does not diagnose, recommend medications, or replace a doctor. Whenever a condition may be involved, it will state: “Please have a doctor make the determination.”
Related Skills
View all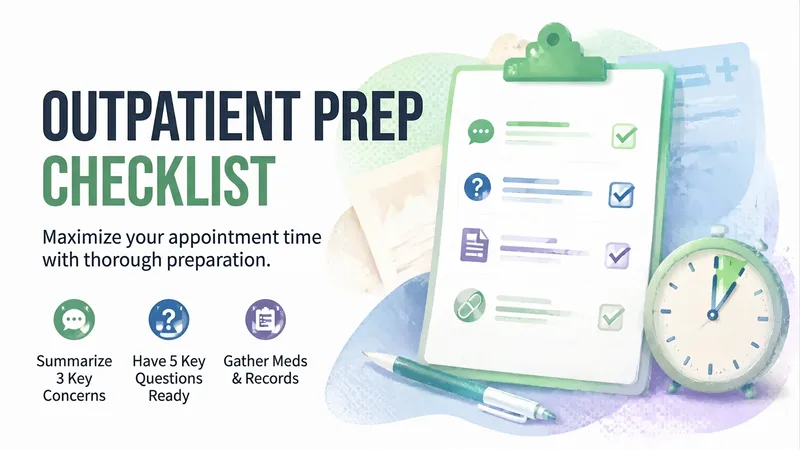
Outpatient Visit Prep
Outpatient visits average just ten minutes, and most people remember what they meant to ask only after they leave. This Skill helps you prepare before seeing the doctor: a three-sentence summary that explains your situation in 30 seconds, five prioritized questions, a complete list of reports and medications to bring, and ways to ask for clarification when the doctor uses unfamiliar terms without disrupting the conversation. Ground rules: it never diagnoses, evaluates medications, or provides alternatives. If signs of an emergency appear, it reminds you to seek medical care immediately. It doesn’t replace your doctor—it helps you make the most of your time with them. Best for people who don’t know what to say at a first visit or have trouble understanding reports at follow-ups.
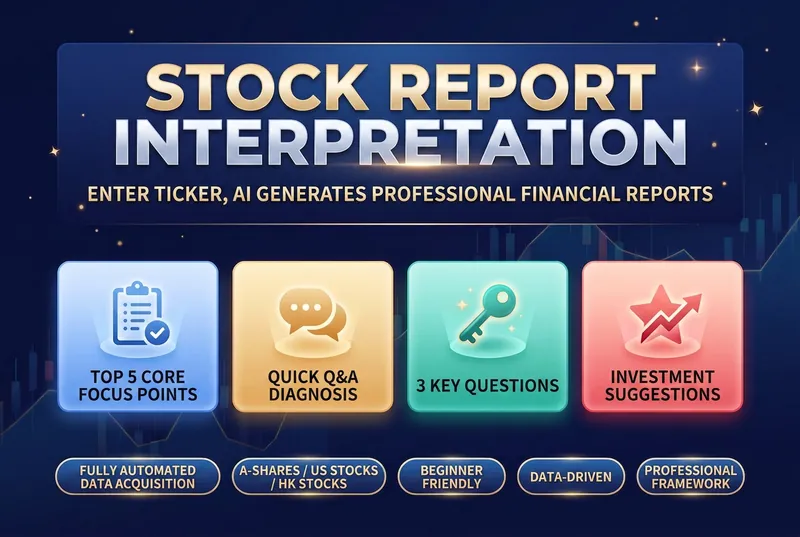
Stock Report Analyzer
Financial reports are a listed company's "physical exam report", but most investors feel lost when faced with pages of dense numbers: • 📝 Can't read the three financial statements — What do the balance sheet, income statement, and cash flow statement tell you? Which numbers matter most? • 🤔 Don't know what to look at — With dozens of pages, which key metrics should you focus on? • 📊 Lack an analysis framework — Even when you find the data, how do you judge good from bad and cross-check it? • 🏭 Industry standards differ — What counts as "good" varies completely by industry; manufacturing and internet companies can't be measured with the same yardstick. • ⏰ Time cost is too high — Manually looking up data, comparing peers, and calculating growth rates can take hours for one report. This skill was built to solve exactly these problems. It automates a professional financial analyst's framework, so you just need to enter a stock code to get a structured, logical, and beginner-friendly financial report interpretation. The tool's core value lies in its rigorous analysis framework, covering multiple dimensions from assessing growth quality to analyzing business models. It not only compares core metrics like revenue, gross margin, net margin, and cash flow, but also runs a quick Q&A on the seven key financial questions investors care about most. It clearly shows whether profits are turning into real cash, and whether receivables and inventory carry potential risks. By benchmarking against industry leaders, it helps you identify a company's true position in its industry chain. When generating the report, it also evaluates valuation levels, core strengths, and potential risks, and offers data-driven recommendations on what to watch. All analysis is presented in intuitive tables and plain, easy-to-understand language, turning complex accounting terms into concrete investment logic. Whether for daily review or deep research, it helps you quickly zero in on the core issue amid massive amounts of data, improving the efficiency and accuracy of your investment decisions.
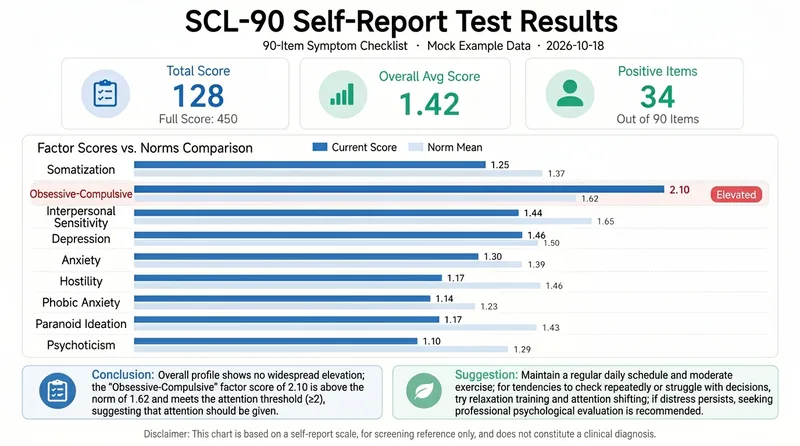
SCL-90 Assessment & Report
Complete the SCL-90 (90-Item Symptom Checklist) through conversation and receive clear, supportive, easy-to-review psychological symptom screening results. Before you begin, the assessment explains its scope, the requirement to answer based on the past week, the 5-point rating scale, who it is intended for, and that it is not diagnostic. You can choose to answer one item at a time, 10 items at a time, or all at once. The process respects your pace, does not predict results, and does not lead your answers. The system collects and validates all responses against the standard items, promptly identifying unanswered questions, formatting errors, or ratings outside the allowed range. After completion, it calculates core measures such as the total score, overall mean score, and number of positive items, then analyzes 9 dimensions including somatization, obsessive-compulsive symptoms, interpersonal sensitivity, depression, and anxiety. It compares the results with reference norms to provide an easy-to-understand interpretation, screening notes, and moderate self-regulation suggestions. The results are for self-understanding and preliminary screening only and do not replace professional diagnosis or treatment. If signals related to self-harm, suicide, or harming others appear in your responses, the system will prioritize compassionate support, safety reminders, and help-seeking resources. After completing the assessment, you can also generate a Chinese-language visual results graphic containing core measures, factor comparisons, screening conclusions, suggestions, and a disclaimer, along with a written summary. If needed, you can save the assessment report for your records.
Information
- Version
- v2
- Last updated
- Runtime credits
- Usage-based
- Models
- Auto