
Data Analysis Pipeline
Raw tables to charted reports, one pipeline
Description
📊 From raw Excel to reports with charts, all in one pipeline—no more jumping between multiple tools. 🔁 Four-stage analytical relay (AI automatically switches analysis style—no need to manually change models): 🧹 Data cleaning: automatically handles nulls, outliers, formatting, and duplicates, outputting clean tables 🔬 Deep analysis: descriptive statistics, correlation, attribution, trends, hypothesis testing, with supporting data evidence 📈 Visualization: automatically selects optimal chart types—2–4 core charts explained in one sentence 📝 Report writing: conclusion-first, well-structured analysis reports in Chinese, with actionable recommendations 👥 Use cases: business data analysis, operational reviews, financial reports, user behavior research, academic data exploration—any scenario where you need to turn tables into insights. 💡 Default output is Markdown reports, convertible to Word/PPT. Report style automatically adjusts based on the reader's role (manager/colleague/yourself).
Related Skills
View all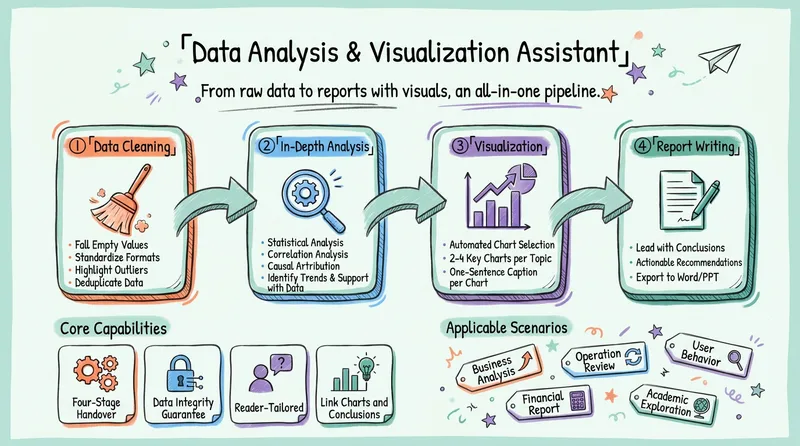
Data Analysis & Visualization V2
From raw tables to reports with charts, this four-step pipeline runs everything in one go: data cleaning → in-depth analysis → visualization → a Chinese report that leads with conclusions. It automatically adapts to the reader’s role and can export to Word/PPT.

Ecommerce Operations Dashboard
📊 **One-sentence value**: Upload store data, and AI automatically generates an e-commerce operations dashboard with core metrics, trend charts, and operational insights. 🔍 **Core features**: - **One-click dashboard generation**: Upload data exported from any e-commerce backend, and it automatically cleans, calculates, and visualizes. - **Five key metric categories**: Traffic, conversion, sales, users, and products—covering all dimensions of operations. - **Multiple dashboard types**: Supports daily reports, live-stream dashboards, product dashboards, and user dashboards, switchable on demand. - **Smart insights engine**: Automatically identifies trend turning points and abnormal fluctuations, and generates actionable operational recommendations. - **Ready to use**: Outputs a standalone HTML dashboard that opens in your browser with a double-click—no configuration required. 🎯 **Use cases**: - 📊 **Daily/weekly report automation**: Generate a daily operations report in 1 minute every day—no more manual spreadsheets. - 📈 **Sales event review**: After 618 or Double 11, generate a full-dimensional review dashboard with one click. - 🛍️ **Multi-platform management**: Unified dashboards for data from Taobao, JD.com, Douyin, and Pinduoduo. - 🎯 **Operations decisions**: Use data to drive product selection, pricing, and campaign strategy adjustments. - 📱 **Live-stream review**: Generate GPM, engagement rate, and conversion funnel from live session data with one click. 👩💼 **Who it's for**: E-commerce operators, store managers, data analysts, live-stream operators, and e-commerce entrepreneurs—anyone who needs to quickly understand their store's performance.
Stock Report Analyzer
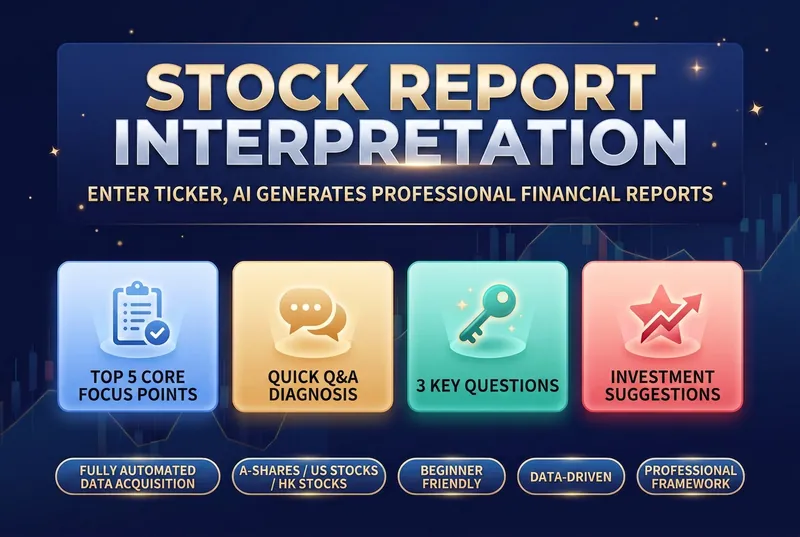
Financial reports are a listed company's "physical exam report", but most investors feel lost when faced with pages of dense numbers: • 📝 Can't read the three financial statements — What do the balance sheet, income statement, and cash flow statement tell you? Which numbers matter most? • 🤔 Don't know what to look at — With dozens of pages, which key metrics should you focus on? • 📊 Lack an analysis framework — Even when you find the data, how do you judge good from bad and cross-check it? • 🏭 Industry standards differ — What counts as "good" varies completely by industry; manufacturing and internet companies can't be measured with the same yardstick. • ⏰ Time cost is too high — Manually looking up data, comparing peers, and calculating growth rates can take hours for one report. This skill was built to solve exactly these problems. It automates a professional financial analyst's framework, so you just need to enter a stock code to get a structured, logical, and beginner-friendly financial report interpretation. The tool's core value lies in its rigorous analysis framework, covering multiple dimensions from assessing growth quality to analyzing business models. It not only compares core metrics like revenue, gross margin, net margin, and cash flow, but also runs a quick Q&A on the seven key financial questions investors care about most. It clearly shows whether profits are turning into real cash, and whether receivables and inventory carry potential risks. By benchmarking against industry leaders, it helps you identify a company's true position in its industry chain. When generating the report, it also evaluates valuation levels, core strengths, and potential risks, and offers data-driven recommendations on what to watch. All analysis is presented in intuitive tables and plain, easy-to-understand language, turning complex accounting terms into concrete investment logic. Whether for daily review or deep research, it helps you quickly zero in on the core issue amid massive amounts of data, improving the efficiency and accuracy of your investment decisions.
Data Analysis Pipeline
Raw tables to charted reports, one pipeline
Description
📊 From raw Excel to reports with charts, all in one pipeline—no more jumping between multiple tools. 🔁 Four-stage analytical relay (AI automatically switches analysis style—no need to manually change models): 🧹 Data cleaning: automatically handles nulls, outliers, formatting, and duplicates, outputting clean tables 🔬 Deep analysis: descriptive statistics, correlation, attribution, trends, hypothesis testing, with supporting data evidence 📈 Visualization: automatically selects optimal chart types—2–4 core charts explained in one sentence 📝 Report writing: conclusion-first, well-structured analysis reports in Chinese, with actionable recommendations 👥 Use cases: business data analysis, operational reviews, financial reports, user behavior research, academic data exploration—any scenario where you need to turn tables into insights. 💡 Default output is Markdown reports, convertible to Word/PPT. Report style automatically adjusts based on the reader's role (manager/colleague/yourself).
Related Skills
View allData Analysis & Visualization V2
From raw tables to reports with charts, this four-step pipeline runs everything in one go: data cleaning → in-depth analysis → visualization → a Chinese report that leads with conclusions. It automatically adapts to the reader’s role and can export to Word/PPT.
Ecommerce Operations Dashboard
📊 **One-sentence value**: Upload store data, and AI automatically generates an e-commerce operations dashboard with core metrics, trend charts, and operational insights. 🔍 **Core features**: - **One-click dashboard generation**: Upload data exported from any e-commerce backend, and it automatically cleans, calculates, and visualizes. - **Five key metric categories**: Traffic, conversion, sales, users, and products—covering all dimensions of operations. - **Multiple dashboard types**: Supports daily reports, live-stream dashboards, product dashboards, and user dashboards, switchable on demand. - **Smart insights engine**: Automatically identifies trend turning points and abnormal fluctuations, and generates actionable operational recommendations. - **Ready to use**: Outputs a standalone HTML dashboard that opens in your browser with a double-click—no configuration required. 🎯 **Use cases**: - 📊 **Daily/weekly report automation**: Generate a daily operations report in 1 minute every day—no more manual spreadsheets. - 📈 **Sales event review**: After 618 or Double 11, generate a full-dimensional review dashboard with one click. - 🛍️ **Multi-platform management**: Unified dashboards for data from Taobao, JD.com, Douyin, and Pinduoduo. - 🎯 **Operations decisions**: Use data to drive product selection, pricing, and campaign strategy adjustments. - 📱 **Live-stream review**: Generate GPM, engagement rate, and conversion funnel from live session data with one click. 👩💼 **Who it's for**: E-commerce operators, store managers, data analysts, live-stream operators, and e-commerce entrepreneurs—anyone who needs to quickly understand their store's performance.
Stock Report Analyzer
Financial reports are a listed company's "physical exam report", but most investors feel lost when faced with pages of dense numbers: • 📝 Can't read the three financial statements — What do the balance sheet, income statement, and cash flow statement tell you? Which numbers matter most? • 🤔 Don't know what to look at — With dozens of pages, which key metrics should you focus on? • 📊 Lack an analysis framework — Even when you find the data, how do you judge good from bad and cross-check it? • 🏭 Industry standards differ — What counts as "good" varies completely by industry; manufacturing and internet companies can't be measured with the same yardstick. • ⏰ Time cost is too high — Manually looking up data, comparing peers, and calculating growth rates can take hours for one report. This skill was built to solve exactly these problems. It automates a professional financial analyst's framework, so you just need to enter a stock code to get a structured, logical, and beginner-friendly financial report interpretation. The tool's core value lies in its rigorous analysis framework, covering multiple dimensions from assessing growth quality to analyzing business models. It not only compares core metrics like revenue, gross margin, net margin, and cash flow, but also runs a quick Q&A on the seven key financial questions investors care about most. It clearly shows whether profits are turning into real cash, and whether receivables and inventory carry potential risks. By benchmarking against industry leaders, it helps you identify a company's true position in its industry chain. When generating the report, it also evaluates valuation levels, core strengths, and potential risks, and offers data-driven recommendations on what to watch. All analysis is presented in intuitive tables and plain, easy-to-understand language, turning complex accounting terms into concrete investment logic. Whether for daily review or deep research, it helps you quickly zero in on the core issue amid massive amounts of data, improving the efficiency and accuracy of your investment decisions.
Find your next favorite skill
Explore more curated AI skills for research, creation, and everyday work.