Daily Investment Brief Generator
Description
Recommended by
nene@YouMind
Why we love this skill
This skill is your smart investment assistant. It automatically captures real-time market data, analyzes liquidity and sentiment, and personalizes a briefing covering macro, crypto, and actionable advice. Helps you easily grasp market dynamics and make informed decisions.
Daily investment brief, integrating multi-dimensional data such as US stocks, cryptocurrencies, macro liquidity, and market sentiment, providing professional market analysis and actionable investment advice. Supports automatic search for real-time data and analysis of relevant materials in the user library. Can use YM's scheduling feature to automatically generate daily. Works more accurately with professional on-chain data tools!!!
Related Skills
View all
US Stock Market Analyst
This skill is designed to provide a comprehensive and professional "US Stock Market Daily Wrap-Up" for investors and traders focused on the US stock market. It offers in-depth analysis of the previous trading day's performance, helping users quickly grasp market dynamics, driving factors, and capital flows. By integrating the latest information from authoritative financial media, data platforms, and official institutions, this skill delivers key content including market indices, sector performance, macroeconomic data, market breadth, and technical analysis. Users can clearly understand major index movements, intraday trend reviews, the impact of US Treasury yields and rate cut expectations on the market, and capital rotation across various industry sectors and themes. Additionally, the report focuses on popular individual stocks such as large-cap tech stocks and AI-related concepts, covering the latest news and unusual activity, along with a detailed earnings calendar and interpretation. Users can access institutional opinions, capital flow analysis, and professional judgments on market risks and future trading opportunities. The final report is presented in a clear and concise structure, facilitating users in reviewing their investments and planning next trading day's strategy.
Stock Report Analyzer
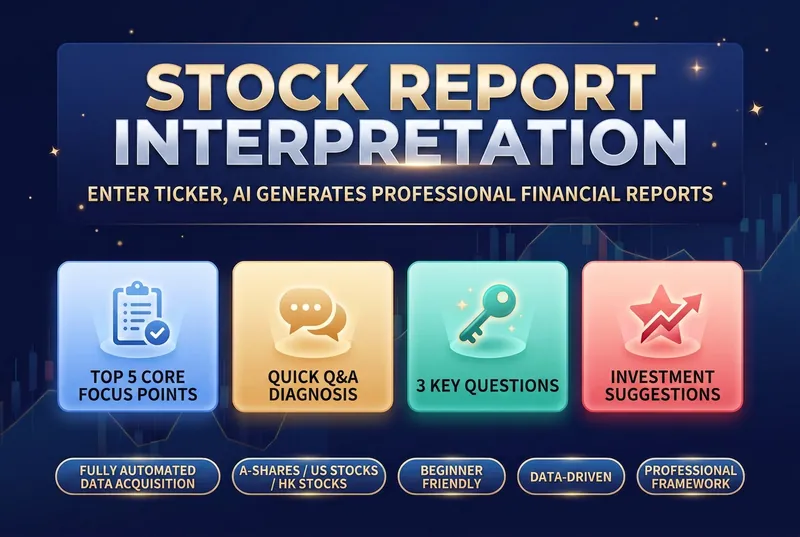
Financial reports are a listed company's "physical exam report", but most investors feel lost when faced with pages of dense numbers: • 📝 Can't read the three financial statements — What do the balance sheet, income statement, and cash flow statement tell you? Which numbers matter most? • 🤔 Don't know what to look at — With dozens of pages, which key metrics should you focus on? • 📊 Lack an analysis framework — Even when you find the data, how do you judge good from bad and cross-check it? • 🏭 Industry standards differ — What counts as "good" varies completely by industry; manufacturing and internet companies can't be measured with the same yardstick. • ⏰ Time cost is too high — Manually looking up data, comparing peers, and calculating growth rates can take hours for one report. This skill was built to solve exactly these problems. It automates a professional financial analyst's framework, so you just need to enter a stock code to get a structured, logical, and beginner-friendly financial report interpretation. The tool's core value lies in its rigorous analysis framework, covering multiple dimensions from assessing growth quality to analyzing business models. It not only compares core metrics like revenue, gross margin, net margin, and cash flow, but also runs a quick Q&A on the seven key financial questions investors care about most. It clearly shows whether profits are turning into real cash, and whether receivables and inventory carry potential risks. By benchmarking against industry leaders, it helps you identify a company's true position in its industry chain. When generating the report, it also evaluates valuation levels, core strengths, and potential risks, and offers data-driven recommendations on what to watch. All analysis is presented in intuitive tables and plain, easy-to-understand language, turning complex accounting terms into concrete investment logic. Whether for daily review or deep research, it helps you quickly zero in on the core issue amid massive amounts of data, improving the efficiency and accuracy of your investment decisions.
 Research
A-share, HK & US Stock Quotes
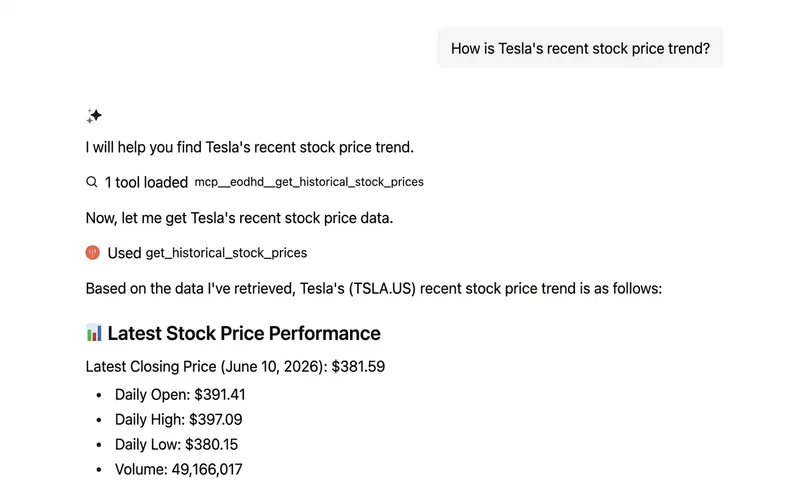
Whether you follow China's A-shares, Hong Kong H-shares, or US-listed stocks, this tool provides real-time and historical market data. You can easily look up a stock's latest price, percentage change, historical trends, dividends, stock splits, and other corporate actions, so you can stay fully informed about your investments. Beyond individual stock analysis, this tool also offers rich macroeconomic data, including US Treasury yields and commodity prices, to help you assess market sentiment and sector rotation. By aggregating company news and market sentiment analysis — especially for US stocks — you can gain deeper insight into what drives the market. For A-shares and Hong Kong stocks, you can also analyze keywords and related stocks in the news to spot industry trends and capital flows. This tool supports batch quote lookups for multiple stocks and can compare the premium or discount of Chinese concept stocks and Hong Kong stocks in the US ADR market, providing valuable context for cross-market investing. Whether you are monitoring the market regularly or quickly investigating unusual price movements, it serves as an efficient investment assistant. Please note that this tool provides data query services only and does not execute trades.
Daily Investment Brief Generator
Description
Recommended by
nene@YouMind
Why we love this skill
This skill is your smart investment assistant. It automatically captures real-time market data, analyzes liquidity and sentiment, and personalizes a briefing covering macro, crypto, and actionable advice. Helps you easily grasp market dynamics and make informed decisions.
Daily investment brief, integrating multi-dimensional data such as US stocks, cryptocurrencies, macro liquidity, and market sentiment, providing professional market analysis and actionable investment advice. Supports automatic search for real-time data and analysis of relevant materials in the user library. Can use YM's scheduling feature to automatically generate daily. Works more accurately with professional on-chain data tools!!!
Related Skills
View allUS Stock Market Analyst
This skill is designed to provide a comprehensive and professional "US Stock Market Daily Wrap-Up" for investors and traders focused on the US stock market. It offers in-depth analysis of the previous trading day's performance, helping users quickly grasp market dynamics, driving factors, and capital flows. By integrating the latest information from authoritative financial media, data platforms, and official institutions, this skill delivers key content including market indices, sector performance, macroeconomic data, market breadth, and technical analysis. Users can clearly understand major index movements, intraday trend reviews, the impact of US Treasury yields and rate cut expectations on the market, and capital rotation across various industry sectors and themes. Additionally, the report focuses on popular individual stocks such as large-cap tech stocks and AI-related concepts, covering the latest news and unusual activity, along with a detailed earnings calendar and interpretation. Users can access institutional opinions, capital flow analysis, and professional judgments on market risks and future trading opportunities. The final report is presented in a clear and concise structure, facilitating users in reviewing their investments and planning next trading day's strategy.
Stock Report Analyzer
Financial reports are a listed company's "physical exam report", but most investors feel lost when faced with pages of dense numbers: • 📝 Can't read the three financial statements — What do the balance sheet, income statement, and cash flow statement tell you? Which numbers matter most? • 🤔 Don't know what to look at — With dozens of pages, which key metrics should you focus on? • 📊 Lack an analysis framework — Even when you find the data, how do you judge good from bad and cross-check it? • 🏭 Industry standards differ — What counts as "good" varies completely by industry; manufacturing and internet companies can't be measured with the same yardstick. • ⏰ Time cost is too high — Manually looking up data, comparing peers, and calculating growth rates can take hours for one report. This skill was built to solve exactly these problems. It automates a professional financial analyst's framework, so you just need to enter a stock code to get a structured, logical, and beginner-friendly financial report interpretation. The tool's core value lies in its rigorous analysis framework, covering multiple dimensions from assessing growth quality to analyzing business models. It not only compares core metrics like revenue, gross margin, net margin, and cash flow, but also runs a quick Q&A on the seven key financial questions investors care about most. It clearly shows whether profits are turning into real cash, and whether receivables and inventory carry potential risks. By benchmarking against industry leaders, it helps you identify a company's true position in its industry chain. When generating the report, it also evaluates valuation levels, core strengths, and potential risks, and offers data-driven recommendations on what to watch. All analysis is presented in intuitive tables and plain, easy-to-understand language, turning complex accounting terms into concrete investment logic. Whether for daily review or deep research, it helps you quickly zero in on the core issue amid massive amounts of data, improving the efficiency and accuracy of your investment decisions.
ResearchA-share, HK & US Stock Quotes
Whether you follow China's A-shares, Hong Kong H-shares, or US-listed stocks, this tool provides real-time and historical market data. You can easily look up a stock's latest price, percentage change, historical trends, dividends, stock splits, and other corporate actions, so you can stay fully informed about your investments. Beyond individual stock analysis, this tool also offers rich macroeconomic data, including US Treasury yields and commodity prices, to help you assess market sentiment and sector rotation. By aggregating company news and market sentiment analysis — especially for US stocks — you can gain deeper insight into what drives the market. For A-shares and Hong Kong stocks, you can also analyze keywords and related stocks in the news to spot industry trends and capital flows. This tool supports batch quote lookups for multiple stocks and can compare the premium or discount of Chinese concept stocks and Hong Kong stocks in the US ADR market, providing valuable context for cross-market investing. Whether you are monitoring the market regularly or quickly investigating unusual price movements, it serves as an efficient investment assistant. Please note that this tool provides data query services only and does not execute trades.
Find your next favorite skill
Explore more curated AI skills for research, creation, and everyday work.