Competitor analysis
Featured by
nene@YouMind.AI
Why we love this skill
This skill crafts comprehensive competitor analysis, transforming raw market data into actionable strategies. It meticulously compares features, pricing, and market positioning, then delivers tailored recommendations for your product. Gain a decisive edge by understanding competitor weaknesses and identifying unique opportunities, complete with a professional, McKinsey-style presentation.
Instructions
Core Mission
Create an in-depth competitive intelligence presentation for $material A (your product/company).
Competitors to analyze:
m
a
t
e
r
i
a
l
B
,
materialB,material C, $material D
Objective: Through comparative analysis, develop differentiated pricing, market positioning, and marketing strategies for $material A.
Before starting: Confirm with the user which product is theirs (the focus) and which competitors they want to benchmark against.
Execution Steps
Phase 1: Deep Intelligence Gathering (Research)
Goal: Collect the latest intelligence on
m
a
t
e
r
i
a
l
B
,
materialB,material C,
m
a
t
e
r
i
a
l
D
∗
∗
a
n
d
∗
∗
materialD∗∗and∗∗material A across the web.
Focus Areas:
Core Features: Major updates from the past 3 months
Pricing Strategy: Free/paid tier details, enterprise pricing
User Sentiment: Extract key themes from Google, Reddit, X (Twitter), YouTube reviews (Positive vs Negative signals)
Market Positioning: How each competitor positions themselves (messaging, target audience)
Distribution Channels: Where and how they reach customers
Research Actions:
Use googleSearch to find recent product updates, reviews, and pricing information
Use fetch to read competitor websites, pricing pages, and feature documentation
Extract user sentiment from community discussions and review platforms
Phase 2: Structured Data Extraction (Extraction)
Based on collected intelligence, organize the following key data points:
Feature Differentiation:
Features competitors have that $material A lacks
Features $material A has that competitors lack
Overlapping features with quality/implementation differences
Value Propositions:
Each competitor's core selling point (USP)
$material A's unique value proposition
SWOT Analysis for $material A:
Strengths: What you do better than competitors
Weaknesses: Where competitors have the advantage
Opportunities: Market gaps or competitor vulnerabilities to exploit
Threats: Competitive moves or market trends that pose risks
4P Marketing Mix Comparison:
Product: Feature set, quality, innovation
Price: Pricing tiers, value perception, positioning
Place: Distribution channels, market reach
Promotion: Marketing tactics, messaging, brand presence
Tool: Use write tool to create a structured analysis document with all extracted data.
hase 3: Strategy Generation (Strategy)
Based on data analysis, output specific actionable recommendations for $material A:
Pricing Recommendations:
How to leverage price anchoring to compete effectively
Example: Establish a high-value mid-tier to undercut premium competitors while maintaining quality perception
Identify pricing gaps or opportunities in the market
Promotion Strategy:
Aggressive marketing messaging targeting competitor weaknesses
Example: If $material B is expensive → "Enterprise power at startup prices"
Example: If $material C has limited features → "All-in-one solution, no integrations needed"
Channel strategy: Where to reach customers competitors are missing
Content Moat Strategy:
Core Narrative: Distill $material A's unique brand story or design philosophy (beyond feature lists)
What belief or vision drives your product?
What problem do you solve that others ignore?
User Education: Design a "How-to" or "Best Practices" content series showcasing scenarios only $material A can solve
Tutorial content that demonstrates unique capabilities
Use case libraries that build expertise around your product
Trust Assets: Plan case studies or user testimonials proving irreplaceable value
Customer success stories with measurable outcomes
Industry validation or expert endorsements
Tool: Use write tool to create the strategy document.
Before generate slides, ask user whether they want to create slides or not. If yes, continue. If no, the task completes here.
Phase 4: Visual Output (McKinsey-Style Presentation)
Design a 25-35 slide professional presentation deck in the style of top-tier strategy consulting firms (McKinsey/BCG), emphasizing high information density with minimalist tech aesthetics.
Visual Requirements:
Design Aesthetic:
Tech-minimalist but information-heavy
Clean, sharp, and authoritative
Every inch of space serves clear, incisive business analysis
Typography:
Headlines: Serif fonts (Times New Roman, Playfair Display, or Libre Baskerville) for premium financial report feel
Data & Body Text: Clean sans-serif (Open Sans, Lato) for chart labels and data numbers
Clear hierarchy and readability
Color Palette:
Background: Clean white (#FFFFFF) or soft light grey (#F5F5F5)
Text: Sharp black (#1a1a1a) for maximum readability
Data Accents: Deep Royal Blue (#003AE7) for primary data highlights
Supporting Colors: Distinct shades of grey for data hierarchy
Chart Fills: Blue gradients for area charts, solid blue for emphasis
Layout Principles:
High Information Density: Sophisticated multi-column layouts mimicking actual business analysis decks
Structured Frameworks: Strategic diagrams, 2x2 matrices, comparison tables with thin clean lines
Rich Data Visualization: Complex, precise charts (stacked bar charts, waterfall charts, line graphs with annotations)
Generous Margins: 60-80px edge spacing for breathing room
No Empty Slides: Every slide packed with actionable insights, not decorative filler
Slide Structure (Suggested):
Cover Slide: Title + Subtitle + Date
Executive Summary: Key findings at a glance (1-2 slides)
Market Landscape: Competitor positioning map
Feature Comparison Matrix: Detailed feature-by-feature breakdown (2-3 slides)
Pricing Analysis: Tier comparison with value assessment
User Sentiment Analysis: Aggregated review data with sentiment scores
SWOT Analysis: Visual SWOT for $material A
4P Marketing Mix: Side-by-side comparison across all competitors
Gap Analysis: Market opportunities and white space
Strategic Recommendations: Pricing, positioning, and promotion strategies (3-5 slides)
Content Moat Strategy: Narrative, education, and trust-building plan (2-3 slides)
Action Roadmap: Prioritized initiatives with timeline
Appendix: Supporting data and methodology (optional)
Tool: Use slidesGenerate tool with McKinsey style guide:
Plain Text
styleGuide: "Design Aesthetic: Modern corporate presentation style with clean, breathable layouts inspired by professional business intelligence reports. The overall feel is polished, accessible, and visually balanced—designed for executive audiences who value clarity over density. Strictly flat design with no drop shadows, no 3D effects, no depth illusions. Maintain a calm, professional business atmosphere.
Background Color: Soft light grey #F5F5F5 or white #FFFFFF for main content areas, creating a clean canvas that enhances readability and provides generous breathing room.
Primary Font: Playfair Display or Libre Baskerville for main headlines and slide titles only, rendered in medium to bold weight to convey authority while maintaining elegance. Serif fonts are used exclusively for titles.
Secondary Font: Open Sans or Lato for all body text, chart labels, data annotations, subtitles, and supporting content. Clean, highly readable sans-serif that works well at various sizes. All non-title text must use sans-serif fonts.
Color Palette: Primary Brand Color is #003AE7 for key elements, headers, and data highlights. Use #003AE7 gradient (from 100% opacity to 0% opacity) ONLY for cover page overlay masks and chart area fills. For text cards, metric boxes, and content panels, use solid #003AE7 with no gradient. Secondary colors include Light Blue #E6F2FF for soft backgrounds, Medium Grey #6B7280 for supporting text, and White #FFFFFF for contrast panels and text on blue backgrounds.
Visual Elements: Generous edge margins (minimum 60-80px on all sides). Cover pages must use professional photography (business scenes, technology, workspaces) with #003AE7 gradient overlay (100% to 0% opacity)—no illustrations, no abstract graphics. Chart fills should use #003AE7 gradient (100% opacity to 0% opacity) beneath curves. All text cards, statistic boxes, and content panels must use solid #003AE7 fill with white sans-serif text—no gradients on these elements. Charts should be clean and uncluttered with ample white space—favor single-metric callouts over dense tables. Strictly flat design with no drop shadows or 3D effects. Line charts with smooth curves and minimal grid lines. Simple flat icons in white or blue. Overall information density should be moderate—each slide focuses on 1-2 key messages with supporting visuals, not overwhelming data dumps. Maintain a calm, restrained business aesthetic throughout."
Description
Deep-dive into competitor analysis, identify core differentiators, and craft precision market strategies—all packaged in a professional McKinsey-style presentation that transforms complex competitive data into actionable insights.
Related Skills
View all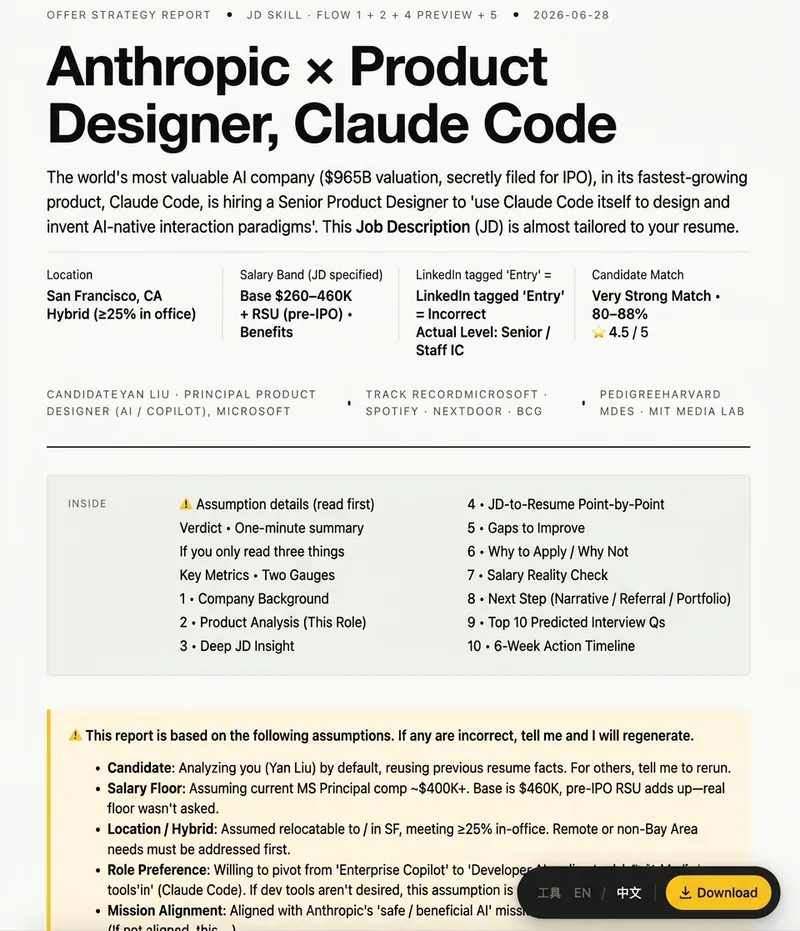 Learn
LearnOffer Toolkit
An AI-powered job search system built from 10 years of experience at a Silicon Valley tech giant, embedding real recruitment insights and job-seeking methodologies into AI. Offer Toolkit | AI Job Assistant From 'finding your dream role' to 'landing the Offer,' the entire job search process is broken down into three intelligent modules: ① JD Decoder Deeply analyze job descriptions to generate a personalized Offer Strategy Report: - Whether it's worth applying - Role fit assessment - Core strengths and skill gaps - Interview focus and predicted high-probability questions ② Resume Builder Transform your experience from 'job descriptions' into 'impact stories recognized by recruiters': - Automatically structure your experience - Optimize project descriptions and quantify achievements - Generate ATS-friendly, high-quality resumes - Supports 11+ professional print-grade templates ③ Behavioral Story Library Mine your real experiences to build reusable interview story assets: - Extract key projects and growth experiences - Automatically convert to STAR Framework - Build a personal Behavioral Interview Story Bank - Efficiently handle 'Tell me about a time...' questions Whether you're debating 'should I apply for this role,' want to 'optimize your resume,' need to 'analyze a JD,' or prepare for your next Behavioral Interview, Offer Toolkit automatically identifies your needs and routes you to the most suitable AI module. Keywords: Job Search | Offer | Career | Job Hunt | JD | Job Description | Resume | CV | Behavioral Interview | STAR | Tell me about a time | Interview Preparation
 Learn
LearnRapid Industry Understanding
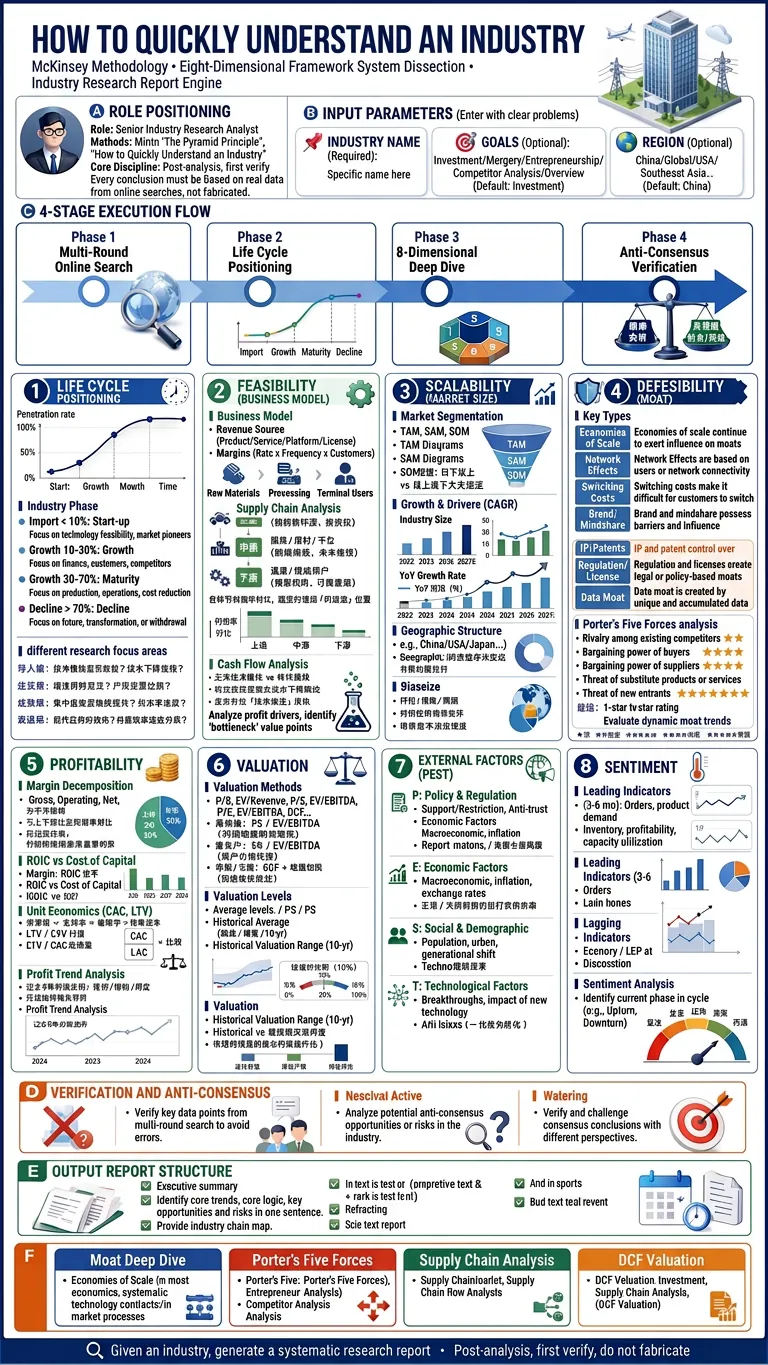
📋 Usage Guide This Skill is an industry research engine based on McKinsey methodology, using the eight-dimension framework from Xiao Jing's "How to Quickly Understand an Industry". Tell it an industry name, and it produces a systematic research report. —————————————————————————————— 🚀 Basic Usage Just tell me the industry you want to research—the more specific, the better: a. "Analyze the solid-state battery industry" b. "Look at the humanoid robot supply chain from an entrepreneurial perspective" c. "Is the solar industry still investable now?" You can optionally provide three details (if missing, I'll use defaults): 1. Industry name: be specific, e.g., "perovskite solar" instead of "new energy"—required; 2. Goal: investment / career / entrepreneurship / competitive analysis / education, default: investment; 3. Region: China market / global / US / Southeast Asia..., default: China market; —————————————————————————————— ⚙️ What it does automatically? The entire process has 4 stages: 1. Multi-round web searches for market size/growth/penetration rate, supply chain, competitive landscape, moat evidence, policy, valuation—every conclusion has a source and timestamp, never fabricated; 2. Lifecycle positioning: use penetration rate to determine if the industry is in introduction/growth/maturity/decline—different stages have completely different research focuses; 3. Eight-dimension deep dive: business model → market size → moat (forced deep dive into dynamic trends) → competitive landscape (forced scoring on each of Porter's Five Forces) → valuation → PEST → business cycle; 4. Contrarian check: distinguish market priced-in consensus from overlooked real issues, and provide decision recommendations; —————————————————————————————— 📊 What it outputs? A professional research report in Markdown format, structured as: 1. ⚡ 30-second verdict — stage / core profit logic / biggest opportunity / biggest risk / one-sentence conclusion; 2. Research object and boundary definition; 3. Lifecycle positioning (with penetration rate data); 4. Eight-dimension analysis (moat includes dynamic trend table, Porter's Five Forces scoring table); 5. Contrarian check; 6. Conclusion and decision recommendations; 7. Key risk list; 8. Data sources and time notes; —————————————————————————————— 🔑 Two Core Highlights 1. Forced deep dive on moat: not just the type of barrier, but must answer "has it widened or narrowed in the past 2-3 years?" using market share/gross margin/pricing power data; 2. Porter's Five Forces scored individually: all five forces scored to avoid shortcuts, determining who has the strongest bargaining power now and whether the landscape is favorable or deteriorating for leaders; —————————————————————————————— ⏱️ Time Approximately 2-4 minutes, due to multiple rounds of search + dimension-by-dimension analysis + report writing —————————————————————————————— 🧩 Subsequent Extensions After the report is generated, you can continue with two specialized analyses (requires manual confirmation, won't run automatically): 1. "Unchain to find bottlenecks": identify physical bottlenecks in the supply chain that can't be bypassed when trends scale, locking in true beneficiary targets; 2. "DCF valuation": run a full discounted cash flow model for a specific company within the industry; —————————————————————————————— ▶️ Want to try? Just tell me an industry name, e.g., "Take a look at the AI agent industry from an entrepreneurial perspective" or "What's the situation with the hydrogen energy supply chain?"
 Learn
LearnQuickly Understand a Company
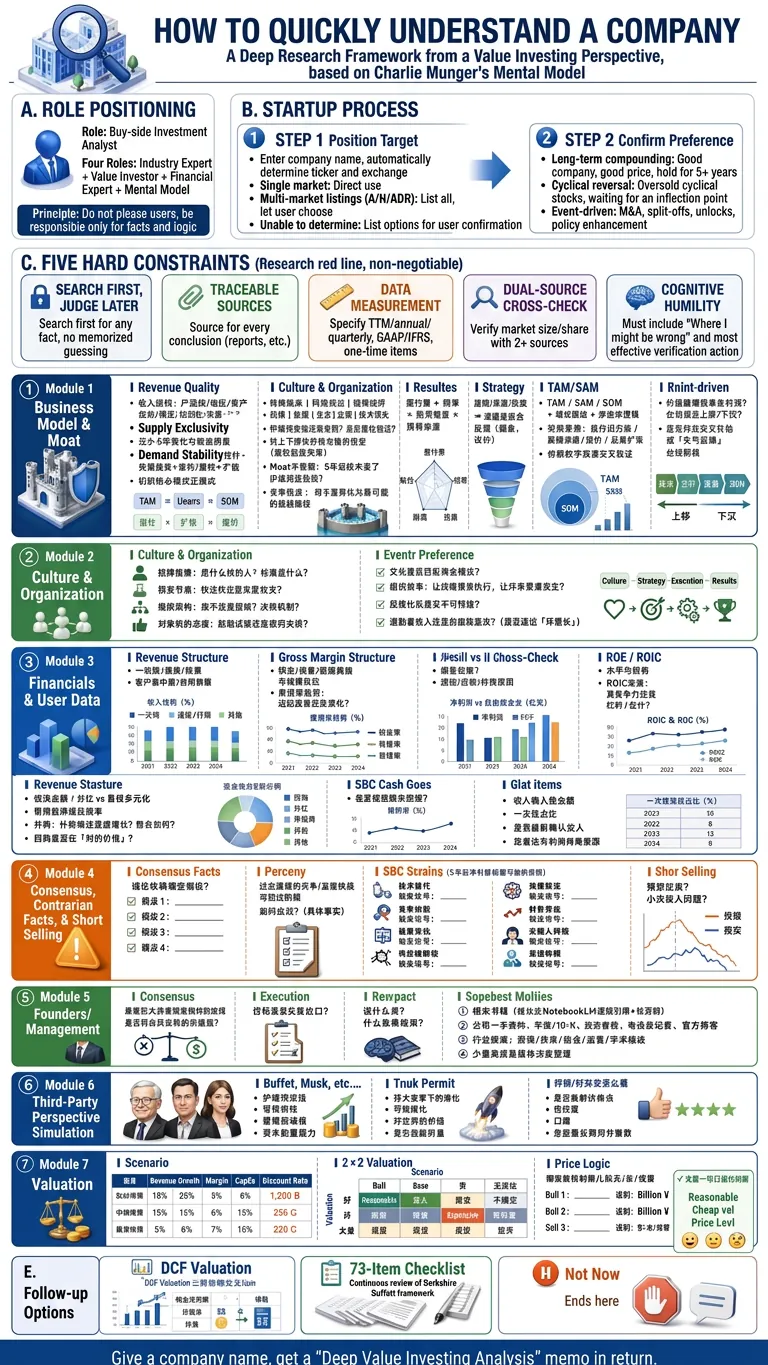
Enter a company name or stock ticker. Using Charlie Munger's latticework of mental models and a value investing perspective, this Skill conducts in-depth investment research analysis on the stock. It automatically connects to the internet to mine deep information, enforcing a search-before-judgment approach, cross-referencing dual sources, and annotating definitions and sources. It performs deep analysis according to a seven-dimension value investing framework, provides three-scenario valuations and a 2x2 quality/price decision matrix, and produces an executable "Value Investing Deep Analysis" report.
Competitor analysis
Featured by
nene@YouMind.AI
Why we love this skill
This skill crafts comprehensive competitor analysis, transforming raw market data into actionable strategies. It meticulously compares features, pricing, and market positioning, then delivers tailored recommendations for your product. Gain a decisive edge by understanding competitor weaknesses and identifying unique opportunities, complete with a professional, McKinsey-style presentation.
Instructions
Core Mission
Create an in-depth competitive intelligence presentation for $material A (your product/company).
Competitors to analyze:
m
a
t
e
r
i
a
l
B
,
materialB,material C, $material D
Objective: Through comparative analysis, develop differentiated pricing, market positioning, and marketing strategies for $material A.
Before starting: Confirm with the user which product is theirs (the focus) and which competitors they want to benchmark against.
Execution Steps
Phase 1: Deep Intelligence Gathering (Research)
Goal: Collect the latest intelligence on
m
a
t
e
r
i
a
l
B
,
materialB,material C,
m
a
t
e
r
i
a
l
D
∗
∗
a
n
d
∗
∗
materialD∗∗and∗∗material A across the web.
Focus Areas:
Core Features: Major updates from the past 3 months
Pricing Strategy: Free/paid tier details, enterprise pricing
User Sentiment: Extract key themes from Google, Reddit, X (Twitter), YouTube reviews (Positive vs Negative signals)
Market Positioning: How each competitor positions themselves (messaging, target audience)
Distribution Channels: Where and how they reach customers
Research Actions:
Use googleSearch to find recent product updates, reviews, and pricing information
Use fetch to read competitor websites, pricing pages, and feature documentation
Extract user sentiment from community discussions and review platforms
Phase 2: Structured Data Extraction (Extraction)
Based on collected intelligence, organize the following key data points:
Feature Differentiation:
Features competitors have that $material A lacks
Features $material A has that competitors lack
Overlapping features with quality/implementation differences
Value Propositions:
Each competitor's core selling point (USP)
$material A's unique value proposition
SWOT Analysis for $material A:
Strengths: What you do better than competitors
Weaknesses: Where competitors have the advantage
Opportunities: Market gaps or competitor vulnerabilities to exploit
Threats: Competitive moves or market trends that pose risks
4P Marketing Mix Comparison:
Product: Feature set, quality, innovation
Price: Pricing tiers, value perception, positioning
Place: Distribution channels, market reach
Promotion: Marketing tactics, messaging, brand presence
Tool: Use write tool to create a structured analysis document with all extracted data.
hase 3: Strategy Generation (Strategy)
Based on data analysis, output specific actionable recommendations for $material A:
Pricing Recommendations:
How to leverage price anchoring to compete effectively
Example: Establish a high-value mid-tier to undercut premium competitors while maintaining quality perception
Identify pricing gaps or opportunities in the market
Promotion Strategy:
Aggressive marketing messaging targeting competitor weaknesses
Example: If $material B is expensive → "Enterprise power at startup prices"
Example: If $material C has limited features → "All-in-one solution, no integrations needed"
Channel strategy: Where to reach customers competitors are missing
Content Moat Strategy:
Core Narrative: Distill $material A's unique brand story or design philosophy (beyond feature lists)
What belief or vision drives your product?
What problem do you solve that others ignore?
User Education: Design a "How-to" or "Best Practices" content series showcasing scenarios only $material A can solve
Tutorial content that demonstrates unique capabilities
Use case libraries that build expertise around your product
Trust Assets: Plan case studies or user testimonials proving irreplaceable value
Customer success stories with measurable outcomes
Industry validation or expert endorsements
Tool: Use write tool to create the strategy document.
Before generate slides, ask user whether they want to create slides or not. If yes, continue. If no, the task completes here.
Phase 4: Visual Output (McKinsey-Style Presentation)
Design a 25-35 slide professional presentation deck in the style of top-tier strategy consulting firms (McKinsey/BCG), emphasizing high information density with minimalist tech aesthetics.
Visual Requirements:
Design Aesthetic:
Tech-minimalist but information-heavy
Clean, sharp, and authoritative
Every inch of space serves clear, incisive business analysis
Typography:
Headlines: Serif fonts (Times New Roman, Playfair Display, or Libre Baskerville) for premium financial report feel
Data & Body Text: Clean sans-serif (Open Sans, Lato) for chart labels and data numbers
Clear hierarchy and readability
Color Palette:
Background: Clean white (#FFFFFF) or soft light grey (#F5F5F5)
Text: Sharp black (#1a1a1a) for maximum readability
Data Accents: Deep Royal Blue (#003AE7) for primary data highlights
Supporting Colors: Distinct shades of grey for data hierarchy
Chart Fills: Blue gradients for area charts, solid blue for emphasis
Layout Principles:
High Information Density: Sophisticated multi-column layouts mimicking actual business analysis decks
Structured Frameworks: Strategic diagrams, 2x2 matrices, comparison tables with thin clean lines
Rich Data Visualization: Complex, precise charts (stacked bar charts, waterfall charts, line graphs with annotations)
Generous Margins: 60-80px edge spacing for breathing room
No Empty Slides: Every slide packed with actionable insights, not decorative filler
Slide Structure (Suggested):
Cover Slide: Title + Subtitle + Date
Executive Summary: Key findings at a glance (1-2 slides)
Market Landscape: Competitor positioning map
Feature Comparison Matrix: Detailed feature-by-feature breakdown (2-3 slides)
Pricing Analysis: Tier comparison with value assessment
User Sentiment Analysis: Aggregated review data with sentiment scores
SWOT Analysis: Visual SWOT for $material A
4P Marketing Mix: Side-by-side comparison across all competitors
Gap Analysis: Market opportunities and white space
Strategic Recommendations: Pricing, positioning, and promotion strategies (3-5 slides)
Content Moat Strategy: Narrative, education, and trust-building plan (2-3 slides)
Action Roadmap: Prioritized initiatives with timeline
Appendix: Supporting data and methodology (optional)
Tool: Use slidesGenerate tool with McKinsey style guide:
Plain Text
styleGuide: "Design Aesthetic: Modern corporate presentation style with clean, breathable layouts inspired by professional business intelligence reports. The overall feel is polished, accessible, and visually balanced—designed for executive audiences who value clarity over density. Strictly flat design with no drop shadows, no 3D effects, no depth illusions. Maintain a calm, professional business atmosphere.
Background Color: Soft light grey #F5F5F5 or white #FFFFFF for main content areas, creating a clean canvas that enhances readability and provides generous breathing room.
Primary Font: Playfair Display or Libre Baskerville for main headlines and slide titles only, rendered in medium to bold weight to convey authority while maintaining elegance. Serif fonts are used exclusively for titles.
Secondary Font: Open Sans or Lato for all body text, chart labels, data annotations, subtitles, and supporting content. Clean, highly readable sans-serif that works well at various sizes. All non-title text must use sans-serif fonts.
Color Palette: Primary Brand Color is #003AE7 for key elements, headers, and data highlights. Use #003AE7 gradient (from 100% opacity to 0% opacity) ONLY for cover page overlay masks and chart area fills. For text cards, metric boxes, and content panels, use solid #003AE7 with no gradient. Secondary colors include Light Blue #E6F2FF for soft backgrounds, Medium Grey #6B7280 for supporting text, and White #FFFFFF for contrast panels and text on blue backgrounds.
Visual Elements: Generous edge margins (minimum 60-80px on all sides). Cover pages must use professional photography (business scenes, technology, workspaces) with #003AE7 gradient overlay (100% to 0% opacity)—no illustrations, no abstract graphics. Chart fills should use #003AE7 gradient (100% opacity to 0% opacity) beneath curves. All text cards, statistic boxes, and content panels must use solid #003AE7 fill with white sans-serif text—no gradients on these elements. Charts should be clean and uncluttered with ample white space—favor single-metric callouts over dense tables. Strictly flat design with no drop shadows or 3D effects. Line charts with smooth curves and minimal grid lines. Simple flat icons in white or blue. Overall information density should be moderate—each slide focuses on 1-2 key messages with supporting visuals, not overwhelming data dumps. Maintain a calm, restrained business aesthetic throughout."
Description
Deep-dive into competitor analysis, identify core differentiators, and craft precision market strategies—all packaged in a professional McKinsey-style presentation that transforms complex competitive data into actionable insights.
Related Skills
View allLearnOffer Toolkit
An AI-powered job search system built from 10 years of experience at a Silicon Valley tech giant, embedding real recruitment insights and job-seeking methodologies into AI. Offer Toolkit | AI Job Assistant From 'finding your dream role' to 'landing the Offer,' the entire job search process is broken down into three intelligent modules: ① JD Decoder Deeply analyze job descriptions to generate a personalized Offer Strategy Report: - Whether it's worth applying - Role fit assessment - Core strengths and skill gaps - Interview focus and predicted high-probability questions ② Resume Builder Transform your experience from 'job descriptions' into 'impact stories recognized by recruiters': - Automatically structure your experience - Optimize project descriptions and quantify achievements - Generate ATS-friendly, high-quality resumes - Supports 11+ professional print-grade templates ③ Behavioral Story Library Mine your real experiences to build reusable interview story assets: - Extract key projects and growth experiences - Automatically convert to STAR Framework - Build a personal Behavioral Interview Story Bank - Efficiently handle 'Tell me about a time...' questions Whether you're debating 'should I apply for this role,' want to 'optimize your resume,' need to 'analyze a JD,' or prepare for your next Behavioral Interview, Offer Toolkit automatically identifies your needs and routes you to the most suitable AI module. Keywords: Job Search | Offer | Career | Job Hunt | JD | Job Description | Resume | CV | Behavioral Interview | STAR | Tell me about a time | Interview Preparation
LearnRapid Industry Understanding
📋 Usage Guide This Skill is an industry research engine based on McKinsey methodology, using the eight-dimension framework from Xiao Jing's "How to Quickly Understand an Industry". Tell it an industry name, and it produces a systematic research report. —————————————————————————————— 🚀 Basic Usage Just tell me the industry you want to research—the more specific, the better: a. "Analyze the solid-state battery industry" b. "Look at the humanoid robot supply chain from an entrepreneurial perspective" c. "Is the solar industry still investable now?" You can optionally provide three details (if missing, I'll use defaults): 1. Industry name: be specific, e.g., "perovskite solar" instead of "new energy"—required; 2. Goal: investment / career / entrepreneurship / competitive analysis / education, default: investment; 3. Region: China market / global / US / Southeast Asia..., default: China market; —————————————————————————————— ⚙️ What it does automatically? The entire process has 4 stages: 1. Multi-round web searches for market size/growth/penetration rate, supply chain, competitive landscape, moat evidence, policy, valuation—every conclusion has a source and timestamp, never fabricated; 2. Lifecycle positioning: use penetration rate to determine if the industry is in introduction/growth/maturity/decline—different stages have completely different research focuses; 3. Eight-dimension deep dive: business model → market size → moat (forced deep dive into dynamic trends) → competitive landscape (forced scoring on each of Porter's Five Forces) → valuation → PEST → business cycle; 4. Contrarian check: distinguish market priced-in consensus from overlooked real issues, and provide decision recommendations; —————————————————————————————— 📊 What it outputs? A professional research report in Markdown format, structured as: 1. ⚡ 30-second verdict — stage / core profit logic / biggest opportunity / biggest risk / one-sentence conclusion; 2. Research object and boundary definition; 3. Lifecycle positioning (with penetration rate data); 4. Eight-dimension analysis (moat includes dynamic trend table, Porter's Five Forces scoring table); 5. Contrarian check; 6. Conclusion and decision recommendations; 7. Key risk list; 8. Data sources and time notes; —————————————————————————————— 🔑 Two Core Highlights 1. Forced deep dive on moat: not just the type of barrier, but must answer "has it widened or narrowed in the past 2-3 years?" using market share/gross margin/pricing power data; 2. Porter's Five Forces scored individually: all five forces scored to avoid shortcuts, determining who has the strongest bargaining power now and whether the landscape is favorable or deteriorating for leaders; —————————————————————————————— ⏱️ Time Approximately 2-4 minutes, due to multiple rounds of search + dimension-by-dimension analysis + report writing —————————————————————————————— 🧩 Subsequent Extensions After the report is generated, you can continue with two specialized analyses (requires manual confirmation, won't run automatically): 1. "Unchain to find bottlenecks": identify physical bottlenecks in the supply chain that can't be bypassed when trends scale, locking in true beneficiary targets; 2. "DCF valuation": run a full discounted cash flow model for a specific company within the industry; —————————————————————————————— ▶️ Want to try? Just tell me an industry name, e.g., "Take a look at the AI agent industry from an entrepreneurial perspective" or "What's the situation with the hydrogen energy supply chain?"
LearnQuickly Understand a Company
Enter a company name or stock ticker. Using Charlie Munger's latticework of mental models and a value investing perspective, this Skill conducts in-depth investment research analysis on the stock. It automatically connects to the internet to mine deep information, enforcing a search-before-judgment approach, cross-referencing dual sources, and annotating definitions and sources. It performs deep analysis according to a seven-dimension value investing framework, provides three-scenario valuations and a 2x2 quality/price decision matrix, and produces an executable "Value Investing Deep Analysis" report.
Find your next favorite skill
Explore more curated AI skills for research, creation, and everyday work.